Fig. 2.
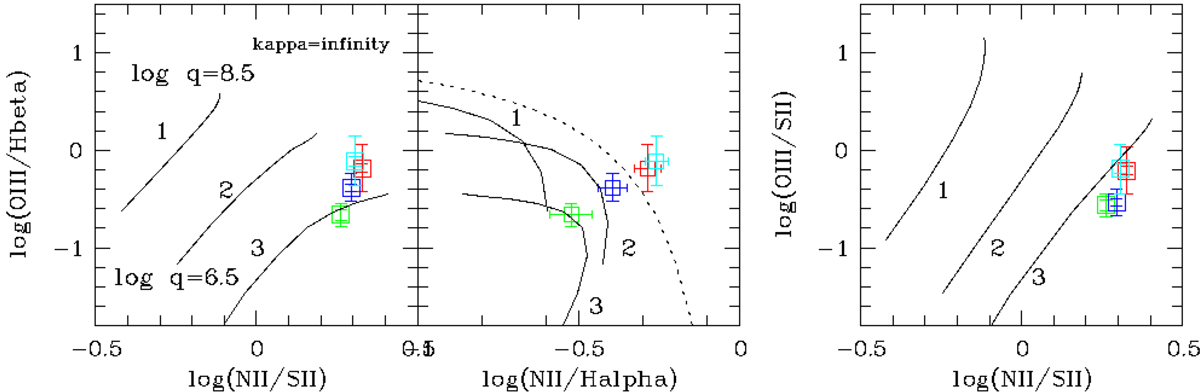
Diagnostic graphs for our four characteristic spectra. Red: total, green: blue spot, blue: middle peak, cyan: the rest (see Table 1). The line ratios from Table 2 are compared to the HII-region models from Dopita et al. (2013) (for a Boltzmann distribution of electrons) with the ionisation parameter log q and three oxygen abundances in solar units (1×, 2×, 3×) as parameters. The solid lines are lines of constant abundance and varying log q. The range of log q values is indicated in the left panel, which is the same for all panels. The dotted line in the middle panel is the line separating HII-regions from AGN-like spectra according to Kauffmann et al. (2003). As noted by Dopita et al. (2013), the right diagnostic graph seems to provide the cleanest separation of log q and oxygen abundance. Spectra 2 and 3 (blue spot and middle peak) show the characteristics of a HII-region and a super solar metallicity in all graphs. The other spectra show contributions from other ionising sources, presumably post-AGB stars. The right panel is apparently insensitive to this circumstance.
Current usage metrics show cumulative count of Article Views (full-text article views including HTML views, PDF and ePub downloads, according to the available data) and Abstracts Views on Vision4Press platform.
Data correspond to usage on the plateform after 2015. The current usage metrics is available 48-96 hours after online publication and is updated daily on week days.
Initial download of the metrics may take a while.