| Issue |
A&A
Volume 636, April 2020
|
|
|---|---|---|
| Article Number | L4 | |
| Number of page(s) | 6 | |
| Section | Letters to the Editor | |
| DOI | https://doi.org/10.1051/0004-6361/202037656 | |
| Published online | 08 April 2020 | |
Letter to the Editor
Spirals inside the millimeter cavity of transition disk SR 21⋆
1
Anton Pannekoek Institute for Astronomy, University of Amsterdam, Science Park 904, 1098XH Amsterdam, The Netherlands
e-mail: This email address is being protected from spambots. You need JavaScript enabled to view it.
2
Leiden Observatory, Leiden University, PO Box 9513, 2300 RA Leiden, The Netherlands
3
Univ. Grenoble Alpes, CNRS, IPAG, 38000 Grenoble, France
4
Unidad Mixta Internacional Franco-Chilena de Astronomía (CNRS, UMI 3386), Departamento de Astronomía, Universidad de Chile, Camino El Observatorio 1515, Las Condes Santiago, Chile
5
Max Planck Institute for Astronomy, Königstuhl 17, 69117 Heidelberg, Germany
6
Institut für Astronomie und Astrophysik, Universität Tübingen, Auf der Morgenstelle 10, 72076 Tübingen, Germany
7
European Southern Observatory, Alonso de Córdova 3107, Casilla, 19001 Vitacura, Santiago, Chile
8
Department of Astronomy, Stockholm University, Stockholm, Sweden
9
Universidad de Chile, Departamento de Astronomia, Camino El Observatorio 1515, Las Condes, Santiago, Chile
10
Institute for Particle Physics and Astrophysics, ETH Zurich, Wolfgang-Pauli-Strasse 27, 8093 Zurich, Switzerland
11
Institute of Astronomy, University of Cambridge, Madingley Road, CB3 0HA Cambridge, UK
12
Núcleo de Astronomía, Facultad de Ingeniería y Ciencias, Universidad Diego Portales, Av. Ejercito 441, Santiago, Chile
13
DOTA, ONERA, Université Paris Saclay, 91123 Palaiseau, France
14
Aix Marseille Université, CNRS, CNES, LAM, Marseille, France
Received:
4
February
2020
Accepted:
17
March
2020
Abstract
Context. Hydrodynamical simulations of planet-disk interactions suggest that planets may be responsible for a number of the substructures frequently observed in disks in both scattered light and dust thermal emission. Despite the ubiquity of these features, direct evidence of planets embedded in disks and of the specific interaction features like spiral arms within planetary gaps are still rare.
Aims. In this study we discuss recent observational results in the context of hydrodynamical simulations in order to infer the properties of a putative embedded planet in the cavity of a transition disk.
Methods. We imaged the transition disk SR 21 in H-band in scattered light with SPHERE/IRDIS and in thermal dust emission with ALMA band 3 (3 mm) observations at a spatial resolution of 0.1″. We combine these datasets with existing Band 9 (430 μm) and Band 7 (870 μm) ALMA continuum data.
Results. The Band 3 continuum data reveals a large cavity and a bright ring peaking at 53 au strongly suggestive of dust trapping. The ring shows a pronounced azimuthal asymmetry, with a bright region in the northwest that we interpret as a dust overdensity. A similarly asymmetric ring is revealed at the same location in polarized scattered light, in addition to a set of bright spirals inside the millimeter cavity and a fainter spiral bridging the gap to the outer ring. These features are consistent with a number of previous hydrodynamical models of planet-disk interactions, and suggest the presence of a ∼1 MJup planet at 44 au and PA = 11 deg. This makes SR21 the first disk showing spiral arms inside the millimeter cavity, and the first disk for which the location of a putative planet can be precisely inferred.
Conclusions. The main features of SR 21 in both scattered light and thermal emission are consistent with hydrodynamical predictions of planet-disk interactions. With the location of a possible planet being well constrained by observations, it is an ideal candidate for follow-up observations to search for direct evidence of a planetary companion still embedded in its disk.
Key words: protoplanetary disks / techniques: polarimetric / scattering
Based on observations performed with SPHERE/VLT under program ID 1100.C-0481(Q).
© ESO 2020
1. Introduction
Protoplanetary disks are the places where planet formation takes place, yet the associated timescales and evolutionary processes are not well constrained by observations. Planet formation is thought to induce morphological features in their parent disk, such as rings and gaps, spiral arms, or vortices. Such structures were indeed detected in a growing sample of disks in millimeter emission and in optical and near-infrared scattered light (see, e.g., Andrews et al. 2018; Avenhaus et al. 2018 for recent examples). If indeed caused by embedded planets, this suggests that planet formation occurs early in the lifetime of the disk. Of particular interest in that respect have been the so-called transition disks. These are disks that show a lack of flux in the 10 μm wavelength range, suggestive of large cavities.
It has been proposed that these cavities are carved out by the emerging protoplanets, yet so far only one such system is known where planets are indeed detected (PDS 70, Keppler et al. 2018; Müller et al. 2018; Haffert et al. 2019). Thus, additional observations are required to make firm the link between planet formation and the opening of cavities.
EM* SR 21 (hereafter, SR 21) is a nearby (138.4±1.1 pc, Gaia Collaboration et al. 2018) member of the Ophiuchus star forming region. SR 21 has a wide (6.7″) binary companion (Barsony et al. 2003) confirmed by recent Gaia DR2 measurements of proper motion and parallax. The presence of a close (∼0.1″) companion (possibly a forming protoplanet) was suggested by Eisner et al. (2009) using mid-IR aperture masking interferometry data, but has not yet been confirmed.
A low-resolution spectroscopic study by Herczeg & Hillenbrand (2014) found SR 21 to be of spectral type F7 with an age of 10 Myr and a mass of 1.67 M⊙. Higher resolution X-shooter observations by Manara et al. (2015) confirmed its status as an intermediate-mass star.
The SR 21 system has been the subject of intense observational study. Brown et al. (2007) utilized Spitzer spectroscopic observations in the IR to classify it as a transition disk with a large inner cavity. Andrews et al. (2011) indeed found an inner cavity radius of the millimeter-sized grains of ∼40 au using SMA observations at 880 μm. This is confirmed with higher spatial resolution ALMA observations at 430 μm by Pérez et al. (2014), who also reports a large asymmetry in the resolved millimeter emission, suggestive of a vortex and a potential spiral structure in the southwest of the disk. It was found by Pontoppidan et al. (2008) that the gas extends much farther inwards to a truncation radius of ∼7 au.
The system was previously observed at near-infrared wavelengths by Follette et al. (2013) who detected morphological differences in polarized scattered light. They found that the small dust grain population extends inside the millimeter cavity. While their data was suggestive of a potential warp in the disk due to a possible change in disk position angle with radius, they did not resolve specific structures inside the millimeter cavity. A very recent study by Sallum et al. (2019) used non-redundant masking imaging data in the near infrared to find a truncation radius of small dust grains between 4 au and 7 au, consistent with the findings of Pontoppidan et al. (2008). Their data is also suggestive of strong asymmetries in the inner disk, caused either by a warp or by spiral features.
We present here new polarized scattered light observations of the SR 21 system carried out with VLT/SPHERE (Spectro-Polarimetric High-contrast Exoplanet REsearch; Beuzit et al. 2019) in the near infrared and with ALMA in Band 3 at 3 mm.
2. Observations and data reduction
In the following we describe the details of the observations of the SPHERE and ALMA observations, and of the data reduction.
2.1. Observations
The SPHERE observations were acquired on March 1, 2018, with SPHERE/IRDIS (Infra-Red Dual-beam Imager and Spectrograph; Dohlen et al. 2008) in dual-beam polarimetric imaging mode (dpi; Langlois et al. 2014; van Holstein et al. 2020; de Boer et al. 2020). We observed the system with the broadband H filter and the broadband J filter. H-band observations were carried out with a Lyot coronagraph in place with an inner working angle of 92.5 mas (Martinez et al. 2009; Carbillet et al. 2011). The conditions during both observation sequences were excellent with seeing varying between 0.44″ and 0.57″ and coherence time above 4 ms. For H-band we recorded 21.3 min of data while for J-band we recorded 13.3 min.
The ALMA Band 3 observations were carried out in Cycle 5 (2017.1.00884.S, PI: Pinilla) on November 9, 2017, with the 12 m array in configuration C43-8 using 44 antennas. The total integration time was 41 min with a maximum baseline of 8.5 km. We note that only these long baseline observations were carried out; we are missing shorter baselines, which limits the maximum recoverable scale to 1.4 arcsec. The spectral setup had two spectral windows centered on the 13CO J = 1–0 and C18O J = 1–0 transitions with rest frequencies at 110.201354 and 109.782176 GHz, and a bandwidth of 937.5 MHz (resolution of 488 kHz) and 234.38 MHz (resolution of 122 kHz), respectively, and two spectral windows for the continuum, centered at 108 GHz. In one of the windows, the correlator was set to time division mode (128 channels, 31.25 MHz resolution and 1875 MHz total bandwidth), while in the other it was set to frequency division mode (3840 channels, 488 kHz resolution, 937.5 MHz total bandwidth).
2.2. Data reduction
The SPHERE observations were reduced with the IRDAP (IRDIS Data reduction for Accurate Polarimetry) pipeline by van Holstein et al. (2020). The pipeline follows largely the polarimetric data reduction as outlined in Ginski et al. (2016) and van Holstein et al. (2017). It includes a full Mueller Matrix model of the instrument and telescope system, and thus can accurately compute and subtract the instrumental polarization. After the initial data reduction to retrieve Stokes Q and U images, the pipeline computes the polar Stokes vector images Qϕ and Uϕ following de Boer et al. (2020). We show the final Qϕ images for the SPHERE H and J-band observations in Fig. 1.
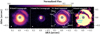 |
Fig. 1. SPHERE/VLT scattered light observations of SR 21. From left to right: H-band observation with coronagraph, J-band observation without coronagraph, annotated H-band data, each normalized to its maximum flux. Rightmost panel: oversaturated cut of the r2-scaled H-band data. Shown in all cases is the Qϕ image. In the H-band epoch the gray hatched software mask indicates the coronagraph, while in J-band it indicates the inner working angle of the polarimetric observations. Indicated in both epochs is the size of one resolution element with white filled circles in the lower left corner. |
Self-calibration was performed on Band 3 using CASA v. 5.1.1 (McMullin et al. 2007), improving the signal-to-noise ratio of the data by a factor of two compared to the product. We used tclean to produce the images of Band 3 data, with Briggs weighting and a robust parameter of 0.0 for the best compromise between resolution and sensitivity. The synthesized beam of the image is 0.10″ × 0.09″ with an rms of 13.6 μJy beam−1, a total flux of 8.2 mJy, with a peak value of 0.35 mJy beam−1 (∼25 × σ). Previous observations at 3.3 mm using ATCA (Ricci et al. 2010) found a total flux of 4.2 mJy, our current observations at similar wavelength suggest twice the ATCA flux. We also use the data presented in Pinilla et al. (2015a,b) in Band 9 (690 GHz) and Band 7 (343 GHz) from Cycle 0 and Cycle 1 ALMA observations (Pérez et al. 2014; van der Marel et al. 2016).
3. Disk morphology
In the following sections we describe the morphology of the disk as seen in scattered light and (sub)millimeter emission and compare it with hydrodynamic models of planet-disk interaction.
3.1. Scattered light images
The H-band polarized scattered light images of SR21 (see Fig. 1, left panel) reveal the complex structure of a nearly face-on disk. An asymmetrical outer ring (Ring 1, third panel Fig. 1) is detected at a radius of ∼0.4″, in a similar location to the continuum emission previously detected in Band 7 (van der Marel et al. 2016) and Band 9 ALMA data (Pérez et al. 2014). This ring is constituted of two bright arcs, along the northwest quadrant (Arc 2) and the south side of the disk (Arc 1), also seemingly coincidental with the two brighter arcs detected in Band 7 by van der Marel et al. (2016). We derive an outer radius of 0.51″ (∼70 au), at the 3σ level, from the (azimuthally averaged) radial polarized intensity profile.
In more detail, the H-band data reveal two bright spiral arms that are visible inside this ring, winding out clockwise, and with the outer one (Spiral 1) being the brighter of the two. They extend from an inner radius of ∼0.14″ (Ring 2), inside the millimeter cavity previously detected with both SMA (Andrews et al. 2011) and ALMA in multiple bands, and rapidly become fainter with increasing radius. A partial gap (Gap 1) or shadow separates them from the outer ring.
The second panel of Fig. 1 shows the J-band non-coronagraphic epoch, where we can see the polarized scattered light extending in as far as ∼0.06″ (∼8 au) from the star. Here we see a third bright ring at this location, consistent with the presence of a gas and micron dust grain cavity in the innermost few au as determined by Pontoppidan et al. (2008).
The right panel of Fig. 1 shows one faint additional feature in an oversaturated cut of the H-band data, in the north side and inside the gap (Gap 1) between the spiral arms and Ring 1. What appears to be a kinked spiral, or possibly a streamer, can be seen wrapping out clockwise, extending from one of the bright inner spirals in the northeast, and out towards the Arc 2 in the northwest. Using the Uϕ image (which contains little or no astrophysical signal) to generate a radial noise map, we find that this feature has a signal-to-noise ratio of ∼3.5 close to the launching point at the inner ring. This signal-to-noise ratio decreases to ∼2.3 near the point where it connects to the outer ring. We note that this signal-to-noise ratio was computed on a pixel-by-pixel basis and does not take into account that a clear shape is visible in the data.
The polar projection of the high-pass filtered H-band image can be seen in the top panel of Fig. 2. The projection showcases the spiral arms, seen here as two diagonal bright lanes, with Spiral 1 showing a varying pitch angle. In this figure we can also see that the Arc 2 region of Ring 1, around 300° to 350° in PA, is not entirely horizontal. Ring 1 is therefore not entirely circular, with the northwestern arc appearing like a spiral feature in the polar projection. A similar behavior can be seen, for example, in the hydrodynamical models from Pinilla et al. (2015a), one of which is shown in the bottom panel of Fig. 2. This model shows the resulting gas surface density from the interaction of two planets in the disk with αturb = 10−3, with mass ratios of 10−4 and 10−3 for the planets located at 1 rp and 3.5 rp, respectively. The location of the outer planet in the model is indicated with a circle in the bottom panel, and is plotted in alignment with the PA location of the kink in the faint spiral feature in the H-band data (circle in the middle panel). Several features of the hydrodynamical model correspond well with the observations. Going from small to large radii we see that the azimuthal location and pitch angle of Spiral 1 and 2 in the observation closely match the model inner Spiral 1 and 2 indicated in the bottom panel. The eccentric gap seen in the model seems at least in part consistent with the observations between PA of ∼200° and 360°. At smaller position angles the observational data is too noisy to confirm the shape of the gap. The observational feature in the outer scattered light ring marked as Arc 1 in the figure may well correspond to the vortex seen in the model. The azimuthal vortex location in the model is not fixed relative to planet position, as can be seen in Pinilla et al. (2015a). The azimuthal position and pitch angle of Arc 2 in the observation match the corresponding model outer spiral exceptionally well.
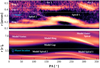 |
Fig. 2. Projection of the SPHERE scattered light image into a polar coordinate system (top panel). Position angle is measured counterclockwise from the north direction. The SPHERE data was scaled by the square of the separation in order to compensate for the drop in flux due to illumination effects. We then high-pass filter prior to re-projection in order to highlight the disk features. Shown is the polar projection of the gas surface density of one of the hydrodynamical models from Pinilla et al. (2015a; bottom panel). The model assumes αturb = 10−3, planet mass ratios of 10−4 and 10−3 with respect to the central star and a ratio of orbital radii of 3.5. We show the location of the outer planet with a circle in the model image, and the location of the kinked spiral in the data in the top panel. |
3.2. Band 3 dust continuum
The Band 3 continuum map of SR 21 is shown in the third panel of Fig. 3. The image shows a narrow (∼0.18″FWHM) ring centered at 0.387″ (determined from a Gaussian fit to the azimuthally averaged radial profile between 0.33″ and 0.66″). This ring largely overlaps with the Ring 1 feature seen in scattered light (Fig. 3), and is brightest in the northwest, at the location of Arc 2. A fragmented or discontinuous second ring, previously unresolved in Band 9 and Band 7 observations (Fig. 3), is seen inside it at a radius of ∼0.23″. This inner ring partially overlaps with the Spiral 1 feature seen in scattered light, as seen in the left panel of Fig. 3.
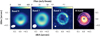 |
Fig. 3. ALMA dust continuum images of SR 21. Band 9 (rms = 3 mJy beam−1) and Band 7 (rms = 0.2 mJy beam−1) were reproduced from Pérez et al. (2014) and Pinilla et al. (2015b), respectively. Our new Band 3 observations (rms = 13.6 μJy beam−1) are shown in the third panel. Beam size and orientation are indicated by the white ellipses in each panel. Right panel: H-band data in the same color scale as Fig. 1, left panel, with the ALMA Band 3 contours at 6, 12, 18, and 24σ overlaid. |
4. Discussion
In the following sections we discuss the observed morphology of the disk in the context of similar observations. In particular, we discuss the hypothesis that one or multiple planets are responsible for the observed disk features.
4.1. Comparison to similar objects
Spirals in disks are known to be a common feature in scattered light observations. Typically in cases where spirals are observed these are the dominating structures in the disk, for example the HD 135344 B system (Muto et al. 2012; Garufi et al. 2013; Stolker et al. 2016), the MWC 758 system (Grady et al. 2013; Benisty et al. 2015), or the LkHa 330 system (Akiyama et al. 2016; Uyama et al. 2018). In all of these cases the scattered light spirals are launched from an inner ring and are the outermost structures visible. Similarly, all of these disks show large opening angles for the spiral structures, varying between ∼10° and 16° for all three disks (Muto et al. 2012; Grady et al. 2013; Benisty et al. 2015; Dong et al. 2015; Uyama et al. 2018).
The scattered light image of SR 21 is remarkably different. While the spirals are still launched from an inner ring-like structure, they are tightly wound, varying between ∼14 and 2° for Spiral 1 (pitch angle decreasing with increasing radius) and < 11° for Spiral 2 (reaching a minimum of close to 0° at a radius of ∼0.2″). They are furthermore located inside yet another ring-like structure seen at larger separations. This outer structure in scattered light corresponds to a narrow ring in ALMA Band 3 observations, the inside of which is mostly devoid of emission and thus largely depleted of millimeter-sized dust grains. Scattered light spirals inside of ALMA emission are only known for a few disks: HD 100453 (Rosotti et al. 2019), V 1247 Ori (Kraus et al. 2017), HD 135344 B (Cazzoletti et al. 2018), and HD 169142 (Gratton et al. 2019). However, both V 1247 Ori and HD 135344 B show a very asymmetric, possibly vortex-like structure that directly connects with the inner scattered light spirals. In both cases, and in HD 169142, there is also millimeter emission farther in, so not a cavity as in the case of SR 21. In the case of HD 100453 the scattered light structures have corresponding millimeter emission features, located at slightly larger radii (Rosotti et al. 2019), while in HD 169142 the scattered light spirals are extremely faint and superposed on much brighter ring structures, making them not the main morphological feature. However, in none of these cases, with the exception of HD 169142, is there a scattered light counterpart detected to the outer millimeter emission. The detection of the outer ring-like structure in SR 21 in scattered light also points to an overall low surface height of the inner structures or a strong flaring of the disk, since otherwise the complete outer ring would be shadowed.
The correspondence of features in small dust particles and gas surface density has been shown by several studies (e.g., Dong et al. 2015 and Rosotti et al. 2016). This is due to the small (micrometer-sized) dust particles that couple well to the gas (i.e., they generally have a low Stokes number). Large (millimeter-sized) dust particles seen in emission by ALMA typically feature higher Stokes numbers and are thus decoupled from the gas. The detection of both structures (inner and outer) in scattered light thus gives the rare opportunity for a close comparison of the SR 21 system with hydrodynamic models of the gas in the disk.
4.2. Indications of planetary companions
The various features seen in the SPHERE and ALMA images can be explained by one or more planetary companions in the disk. Huang et al. (2018) and Dullemond et al. (2018) show that the rings frequently seen in continuum emission from (sub)millimeter grains are likely caused by dust trapping, perhaps due to embedded planets carving gaps in disks as opposed to being related to snow lines. In the case of SR 21 the possibility of a low-mass companion being responsible for carving out this cavity is further supported by the small grains seen in scattered light. These are expected to be closely coupled to the gas, tracing spiral arms confined to the millimeter cavity, as is frequently seen in hydrodynamical models.
Azimuthal asymmetries in the outer ring. It is hard to tell from scattered light alone whether the asymmetry of the outer ring is caused by azimuthally localized overdensities in the gas and dust or if they are the product of shadowing by the inner spiral arms. This asymmetry looks different in all three ALMA bands available: Band 9 shows an asymmetry in the south, while Bands 7 and 3 show a ring-like structure with a bright asymmetry to the north. Pinilla et al. (2015b) have already suggested that the southern bright spot seen in Band 9 may be the result of a hotter region in the southern side of the disk. This is supported by Band 9 being optically thick (peak optical depth of τ∼2.0, assuming a physical temperature of 20 K). Therefore, continuum emission in this band is not only sensitive to density variations, but also to temperature variations, which can produce structure in the emission. In Band 3, where the disk is optically thin (peak optical depth of τ = 0.17 assuming a physical temperature of 20 K), the asymmetry is reversed, with the southern bright spot disappearing and the northern one becoming prominent. This asymmetry, at this low optical depth, suggests that the northern bright spot seen in SPHERE and ALMA Bands 7 and 3 probably corresponds to a dust overdensity at this location of the ring. Band 7, with an intermediate estimated peak optical depth of τ = 0.5, shows both the overdensity and the hot region in the south. Such an overdensity could, for example, be produced in the apastron location of a slightly eccentric disk, where the lower velocity at apastron leads to higher gas densities that can also slow down drifting grains and replicate the overdensity in large grains (Ataiee et al. 2013).
The spiral arms pointing to the likely position of the planet. The “kinked spiral” feature we see to the north in the saturated cut of the H-band data (Fig. 1) is strongly reminiscent of the spirals arising in hydrodynamical models of planet-disk interaction (see, e.g., Nelson et al. 2000; Sándor et al. 2007, or Pinilla et al. 2015b). The position of the kink in the spiral, indicating the exact location of the planet in these hydrodynamical models, is found inside of the ALMA ring and in the gap between this ring and the two brighter inner spirals seen with SPHERE (Fig. 1, right panel). This is consistent with a planet at this location being responsible for carving this gap and thus trapping the larger dust grains in the pressure bump formed outside its orbit. If this is the case, this makes SR21 a prime candidate for the search of a forming planet still interacting with its parent disk, with the location of this planet known a priori and very accurately from the location of the kink in this spiral feature (44 au, PA 11°, see also Fig. 2).
Interaction between spiral and ring. The kinked spiral feature also appears to lead to the northern bright spot (Arc 2) along the SPHERE outer ring (Ring 1), which, as seen in the polar projection (Fig. 2), is not entirely circular. The figure shows the non-zero pitch angle of Arc 2, which is very similar to the pitch angle seen in gas density in hydrodynamical simulations of planet-disk interactions where the spiral wave from the planet meets the outer disk. This is seen in models that were motivated by the Band 9 ALMA data on SR 21, and which show the results of the gaseous component of the disk interacting with two planets embedded in the disk (e.g., Pinilla et al. 2015b). The superposition of the spirals in the gas density between the two planets show a behavior very similar to the bright spirals seen in SR21, with the pitch angle appearing to decrease before increasing again outwards with increasing radius. This complex behavior of the spiral structure might be an indication of a second planet or a binary companion being present in the disk, perhaps in the 7 au cavity inferred by Pontoppidan et al. (2008) and possibly associated with the signal detected by Eisner et al. (2009).
However, we want to point out that there are also similar models available created with just a single planet (see, e.g., Nelson et al. 2000). From our current data we thus cannot conclude on the presence of additional companions inside the scattered light gap.
4.3. Mass constraints
The location of Ring 1 in scattered light versus the millimeter appears to be the same, within uncertainties (the difference in the location of the ALMA and SPHERE rings is ∼13 mas, i.e., a factor 3–4 smaller than the resolution of our H-band data). If trapped in a pressure bump, the location of the large grains is expected to be exterior to that of the small grains observed in scattered light. This radial offset between the rings is larger for larger planetary masses, but can be close to zero for smaller companions, as shown by de Juan Ovelar et al. (2013). If caused by a planet, its mass must be low and close to 1 MJup. Such a low-mass planet can still produce the inner spiral arms seen in scattered light, as shown by Dong et al. (2015).
A low planet mass is also consistent with archival observational data obtained with the Keck telescope and the NIRC2 instrument in the L-band. We discuss this dataset in detail in Appendix A. The Keck observation rules out companions more massive than ∼13 MJup at the location of the scattered light gap in SR21.
5. Conclusions
EM* SR 21 is a disk exhibiting a number of features consistent with hydrodynamical models of planet formation, including the following:
-
a large cavity in (sub)millimeter-sized grains, with evidence of dust-trapping at a radius of ∼54 au;
-
two bright spiral arm structures in scattered light located inside of this cavity;
-
a scattered light counterpart to the millimeter ring at ∼55 au;
-
a faint kinked spiral structure in scattered light, in the gap between the bright inner spirals and the outer ring;
-
evidence of an overdensity in gas and dust on the north side of the disk where the kinked spiral connects to the outer ring.
Furthermore, the radial location of the gap, outer ring, and in particular the kink in the faint spiral allow us to constrain the location of the suspected planet to a radius of ∼44 au and PA of ∼11°. If such a planet is inducing a small eccentricity in the outer disk, it could be causing an overdensity of gas on the north side of the ∼54 au ring, as predicted by Pinilla et al. (2015a). This overdensity could explain both the northern bright region of the ring seen in the scattered light, as well as the overdensity in the larger grains in this region inferred from Bands 7 and 3 continuum emission. Given the radial location of the ring in H-band and Band 3 at ∼1.2 planetary radii in both datasets, we can rule out a planet on the order of > 5 MJup, with a lower mass of ∼1 MJup being favored.
Finally, the irregular behavior of the pitch angles of the two brighter inner spirals could be hinting at a second companion hidden in the inner disk regions not probed by our datasets, and possibly in the 7 au cavity inferred by Pontoppidan et al. (2008).
Acknowledgments
SPHERE is an instrument designed and built by a consortium consisting of IPAG (Grenoble, France), MPIA (Heidelberg, Germany), LAM (Marseille, France), LESIA (Paris, France), Laboratoire Lagrange (Nice, France), INAF – Osservatorio di Padova (Italy), Observatoire de Genève (Switzerland), ETH Zurich (Switzerland), NOVA (Netherlands), ONERA (France), and ASTRON (The Netherlands) in collaboration with ESO. SPHERE was funded by ESO, with additional contributions from CNRS (France), MPIA (Germany), INAF (Italy), FINES (Switzerland), and NOVA (The Netherlands). SPHERE also received funding from the European Commission Sixth and Seventh Framework Programmes as part of the Optical Infrared Coordination Network for Astronomy (OPTICON) under grant number RII3-Ct2004-001566 for FP6 (2004–2008), grant number 226604 for FP7 (2009-2012), and grant number 312430 for FP7 (2013–2016). G.M-A. and C.G. acknowledge funding from the Netherlands Organisation for Scientific Research (NWO) TOP-1 grant as part of the research program “Herbig Ae/Be stars, Rosetta stones for understanding the formation of planetary systems”, project number 614.001.552. FMe, MV, and MB acknowledge funding from ANR of France under contract number ANR-16-CE31-0013. The research of AJB leading to these results has received funding from the European Research Council under ERC Starting Grant agreement 678194 (FALCONER). P.P. acknowledges support provided by the Alexander von Humboldt Foundation in the framework of the Sofja Kovalevskaja Award endowed by the Federal Ministry of Education and Research. D.H. is supported by European Union A-ERC grant 291141 CHEMPLAN, NWO and by a KNAW professor prize awarded to E. van Dishoeck. T.H. acknowledges support from the European Research Council under the Horizon 2020 Framework Program via the ERC Advanced Grant Origins 83 24 28. M.T. has been supported by the UK Science and Technology research Council (STFC), and by the European Union’s Horizon 2020 research and innovation programme under the Marie Sklodowska-Curie grant agreement No. 823823 (RISE DUSTBUSTERS project). This paper makes use of the following ALMA data: ADS/JAO.ALMA#2011.0.00724.S, ADS/JAO.ALMA#2012.1.00158.S, ADS/JAO.ALMA#2017.1.00884.S. ALMA is a partnership of ESO (representing its member states), NSF (USA) and NINS (Japan), together with NRC (Canada), MOST and ASIAA (Taiwan), and KASI (Republic of Korea), in cooperation with the Republic of Chile. The Joint ALMA Observatory is operated by ESO, AUI/NRAO and NAOJ.
References
- Akiyama, E., Hashimoto, J., Liu, H. B., et al. 2016, AJ, 152, 222 [NASA ADS] [CrossRef] [Google Scholar]
- Amara, A., & Quanz, S. P. 2012, MNRAS, 427, 948 [NASA ADS] [CrossRef] [Google Scholar]
- Andrews, S. M., Wilner, D. J., Espaillat, C., et al. 2011, ApJ, 732, 42 [NASA ADS] [CrossRef] [Google Scholar]
- Andrews, S. M., Huang, J., Pérez, L. M., et al. 2018, ApJ, 869, L41 [NASA ADS] [CrossRef] [Google Scholar]
- Ataiee, S., Pinilla, P., Zsom, A., et al. 2013, A&A, 553, L3 [NASA ADS] [CrossRef] [EDP Sciences] [Google Scholar]
- Avenhaus, H., Quanz, S. P., Garufi, A., et al. 2018, ApJ, 863, 44 [NASA ADS] [CrossRef] [Google Scholar]
- Barsony, M., Koresko, C., & Matthews, K. 2003, ApJ, 591, 1064 [NASA ADS] [CrossRef] [Google Scholar]
- Benisty, M., Juhasz, A., Boccaletti, A., et al. 2015, A&A, 578, L6 [NASA ADS] [CrossRef] [EDP Sciences] [Google Scholar]
- Beuzit, J. L., Vigan, A., Mouillet, D., et al. 2019, A&A, 631, A155 [NASA ADS] [CrossRef] [EDP Sciences] [Google Scholar]
- Bohn, A. J., Kenworthy, M. A., Ginski, C., et al. 2020, MNRAS, 492, 431 [NASA ADS] [CrossRef] [Google Scholar]
- Brown, J. M., Blake, G. A., Dullemond, C. P., et al. 2007, ApJ, 664, L107 [NASA ADS] [CrossRef] [Google Scholar]
- Carbillet, M., Bendjoya, P., Abe, L., et al. 2011, Exp. Astron., 30, 39 [NASA ADS] [CrossRef] [Google Scholar]
- Cazzoletti, P., van Dishoeck, E. F., Pinilla, P., et al. 2018, A&A, 619, A161 [NASA ADS] [CrossRef] [EDP Sciences] [Google Scholar]
- de Boer, J., Langlois, M., van Holstein, R. G., et al. 2020, A&A, 633, A63 [NASA ADS] [CrossRef] [EDP Sciences] [Google Scholar]
- de Juan Ovelar, M., Min, M., Dominik, C., et al. 2013, A&A, 560, A111 [NASA ADS] [CrossRef] [EDP Sciences] [Google Scholar]
- Dohlen, K., Langlois, M., Saisse, M., et al. 2008, Proc. SPIE, 7014, 70143L [Google Scholar]
- Dong, R., Zhu, Z., Rafikov, R. R., & Stone, J. M. 2015, ApJ, 809, L5 [NASA ADS] [CrossRef] [Google Scholar]
- Dullemond, C. P., Birnstiel, T., Huang, J., et al. 2018, ApJ, 869, L46 [NASA ADS] [CrossRef] [EDP Sciences] [Google Scholar]
- Eisner, J. A., Monnier, J. D., Tuthill, P., & Lacour, S. 2009, ApJ, 698, L169 [NASA ADS] [CrossRef] [Google Scholar]
- Follette, K. B., Tamura, M., Hashimoto, J., et al. 2013, ApJ, 767, 10 [NASA ADS] [CrossRef] [Google Scholar]
- Gaia Collaboration (Brown, A. G. A.) 2018, VizieR Online Data Catalog: I/345 [Google Scholar]
- Garufi, A., Quanz, S. P., Avenhaus, H., et al. 2013, A&A, 560, A105 [NASA ADS] [CrossRef] [EDP Sciences] [Google Scholar]
- Ginski, C., Stolker, T., Pinilla, P., et al. 2016, A&A, 595, A112 [NASA ADS] [CrossRef] [EDP Sciences] [Google Scholar]
- Grady, C. A., Muto, T., Hashimoto, J., et al. 2013, ApJ, 762, 48 [NASA ADS] [CrossRef] [Google Scholar]
- Gratton, R., Ligi, R., Sissa, E., et al. 2019, A&A, 623, A140 [NASA ADS] [CrossRef] [EDP Sciences] [Google Scholar]
- Haffert, S. Y., Bohn, A. J., de Boer, J., et al. 2019, Nat. Astron., 3, 749 [NASA ADS] [CrossRef] [EDP Sciences] [Google Scholar]
- Herczeg, G. J., & Hillenbrand, L. A. 2014, ApJ, 786, 97 [NASA ADS] [CrossRef] [Google Scholar]
- Huang, J., Andrews, S. M., Dullemond, C. P., et al. 2018, ApJ, 869, L42 [NASA ADS] [CrossRef] [Google Scholar]
- Hunziker, S., Quanz, S. P., Amara, A., & Meyer, M. R. 2018, A&A, 611, A23 [NASA ADS] [CrossRef] [EDP Sciences] [Google Scholar]
- Keppler, M., Benisty, M., Müller, A., et al. 2018, A&A, 617, A44 [NASA ADS] [CrossRef] [EDP Sciences] [Google Scholar]
- Kraus, S., Kreplin, A., Fukugawa, M., et al. 2017, ApJ, 848, L11 [NASA ADS] [CrossRef] [Google Scholar]
- Langlois, M., Dohlen, K., Vigan, A., et al. 2014, Proc. SPIE, 9147, 91471R [CrossRef] [Google Scholar]
- Manara, C. F., Testi, L., Natta, A., & Alcalá, J. M. 2015, A&A, 579, A66 [NASA ADS] [CrossRef] [EDP Sciences] [Google Scholar]
- Martinez, P., Dorrer, C., Aller Carpentier, E., et al. 2009, A&A, 495, 363 [NASA ADS] [CrossRef] [EDP Sciences] [Google Scholar]
- McMullin, J. P., Waters, B., Schiebel, D., Young, W., & Golap, K. 2007, ASP Conf. Ser., 376, 127 [Google Scholar]
- Müller, A., Keppler, M., Henning, T., et al. 2018, A&A, 617, L2 [NASA ADS] [CrossRef] [EDP Sciences] [Google Scholar]
- Muto, T., Grady, C. A., Hashimoto, J., et al. 2012, ApJ, 748, L22 [NASA ADS] [CrossRef] [Google Scholar]
- Nelson, R. P., Papaloizou, J. C. B., Masset, F., & Kley, W. 2000, MNRAS, 318, 18 [NASA ADS] [CrossRef] [Google Scholar]
- Pérez, L. M., Isella, A., Carpenter, J. M., & Chandler, C. J. 2014, ApJ, 783, L13 [NASA ADS] [CrossRef] [Google Scholar]
- Pinilla, P., de Juan Ovelar, M., Ataiee, S., et al. 2015a, A&A, 573, A9 [NASA ADS] [CrossRef] [EDP Sciences] [Google Scholar]
- Pinilla, P., van der Marel, N., Pérez, L. M., et al. 2015b, A&A, 584, A16 [NASA ADS] [CrossRef] [EDP Sciences] [Google Scholar]
- Pontoppidan, K. M., Blake, G. A., van Dishoeck, E. F., et al. 2008, ApJ, 684, 1323 [NASA ADS] [CrossRef] [Google Scholar]
- Ricci, L., Testi, L., Natta, A., & Brooks, K. J. 2010, A&A, 521, A66 [NASA ADS] [CrossRef] [EDP Sciences] [Google Scholar]
- Rosotti, G. P., Juhasz, A., Booth, R. A., & Clarke, C. J. 2016, MNRAS, 459, 2790 [NASA ADS] [CrossRef] [Google Scholar]
- Rosotti, G. P., Benisty, M., Juhász, A., et al. 2019, MNRAS, 2689, 0 [Google Scholar]
- Sallum, S., Skemer, A., Eisner, J., et al. 2019, ApJ, 883, 100 [NASA ADS] [CrossRef] [Google Scholar]
- Sándor, Z., Kley, W., & Klagyivik, P. 2007, A&A, 472, 981 [NASA ADS] [CrossRef] [EDP Sciences] [Google Scholar]
- Stolker, T., Dominik, C., Avenhaus, H., et al. 2016, A&A, 595, A113 [NASA ADS] [CrossRef] [EDP Sciences] [Google Scholar]
- Stolker, T., Bonse, M. J., Quanz, S. P., et al. 2019, A&A, 621, A59 [NASA ADS] [CrossRef] [EDP Sciences] [Google Scholar]
- Uyama, T., Hashimoto, J., Muto, T., et al. 2018, AJ, 156, 63 [NASA ADS] [CrossRef] [Google Scholar]
- van der Marel, N., van Dishoeck, E. F., Bruderer, S., et al. 2016, A&A, 585, A58 [NASA ADS] [CrossRef] [EDP Sciences] [Google Scholar]
- van Holstein, R. G., Girard, J. H., de Boer, J., et al. 2020, A&A, 633, A64 [NASA ADS] [CrossRef] [EDP Sciences] [Google Scholar]
- van Holstein, R. G., Snik, F., Girard, J. H., et al. 2017, SPIE Conf. Ser., 10400, 1040015 [Google Scholar]
Appendix A: Keck L-band detection limits
SR 21 was observed (PI: N. van der Marel) with the NIRC2 camera that is mounted at the Naysmith platform of the Keck II telescope at the W.M. Keck Observatory. The observations were carried out on the night of April 23, 2016, in L-band, and no coronagraph was applied. A sequence of 48 unsaturated images with exposure times of 0.2 s and 100 co-added frames was acquired before the science observations consisting of 120 frames with exposure times of 0.3s and 60 co-adds allowing for a field rotation of  . The data were reduced with PynPoint (v. 0.8.1; Amara & Quanz 2012; Stolker et al. 2019) following the description for NACO data presented in Bohn et al. (2020). This included dark, flat calibration, bad pixel, and background subtraction based on principal component analysis (PCA; Hunziker et al. 2018). The PSFs were centered by a Gaussian fit and we applied ADI+PCA for speckle removal. The contrast as a function of separation was evaluated with the ContrastCurveModule of PynPoint. We scaled the average unsaturated PSF image for the difference in exposure time and injected it in the centered science frames. The contrast was estimated at six azimuthal directions at angular separations increasing from 150 mas to 960 mas in steps of 10 mas. We optimized the number of subtracted principal components as a function of separation. The final curve as presented in Fig. A.1 was obtained by fitting five components for separations smaller than 250 mas and ten components for larger separations. We also converted the magnitude contrast to a threshold of detectable masses by comparison to AMES Cond models evaluated at the system age of 10 Myr. For this conversion we assumed a stellar L’ magnitude of 6.8 mag based on WISE measurements.
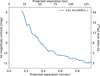 |
Fig. A.1. Detection limits derived from Keck/NIRC2 L-band observations of SR 21. |
All Figures
|
Fig. 1. SPHERE/VLT scattered light observations of SR 21. From left to right: H-band observation with coronagraph, J-band observation without coronagraph, annotated H-band data, each normalized to its maximum flux. Rightmost panel: oversaturated cut of the r2-scaled H-band data. Shown in all cases is the Qϕ image. In the H-band epoch the gray hatched software mask indicates the coronagraph, while in J-band it indicates the inner working angle of the polarimetric observations. Indicated in both epochs is the size of one resolution element with white filled circles in the lower left corner. |
| In the text | |
|
Fig. 2. Projection of the SPHERE scattered light image into a polar coordinate system (top panel). Position angle is measured counterclockwise from the north direction. The SPHERE data was scaled by the square of the separation in order to compensate for the drop in flux due to illumination effects. We then high-pass filter prior to re-projection in order to highlight the disk features. Shown is the polar projection of the gas surface density of one of the hydrodynamical models from Pinilla et al. (2015a; bottom panel). The model assumes αturb = 10−3, planet mass ratios of 10−4 and 10−3 with respect to the central star and a ratio of orbital radii of 3.5. We show the location of the outer planet with a circle in the model image, and the location of the kinked spiral in the data in the top panel. |
| In the text | |
|
Fig. 3. ALMA dust continuum images of SR 21. Band 9 (rms = 3 mJy beam−1) and Band 7 (rms = 0.2 mJy beam−1) were reproduced from Pérez et al. (2014) and Pinilla et al. (2015b), respectively. Our new Band 3 observations (rms = 13.6 μJy beam−1) are shown in the third panel. Beam size and orientation are indicated by the white ellipses in each panel. Right panel: H-band data in the same color scale as Fig. 1, left panel, with the ALMA Band 3 contours at 6, 12, 18, and 24σ overlaid. |
| In the text | |
|
Fig. A.1. Detection limits derived from Keck/NIRC2 L-band observations of SR 21. |
| In the text | |
Current usage metrics show cumulative count of Article Views (full-text article views including HTML views, PDF and ePub downloads, according to the available data) and Abstracts Views on Vision4Press platform.
Data correspond to usage on the plateform after 2015. The current usage metrics is available 48-96 hours after online publication and is updated daily on week days.
Initial download of the metrics may take a while.