Fig. 1.
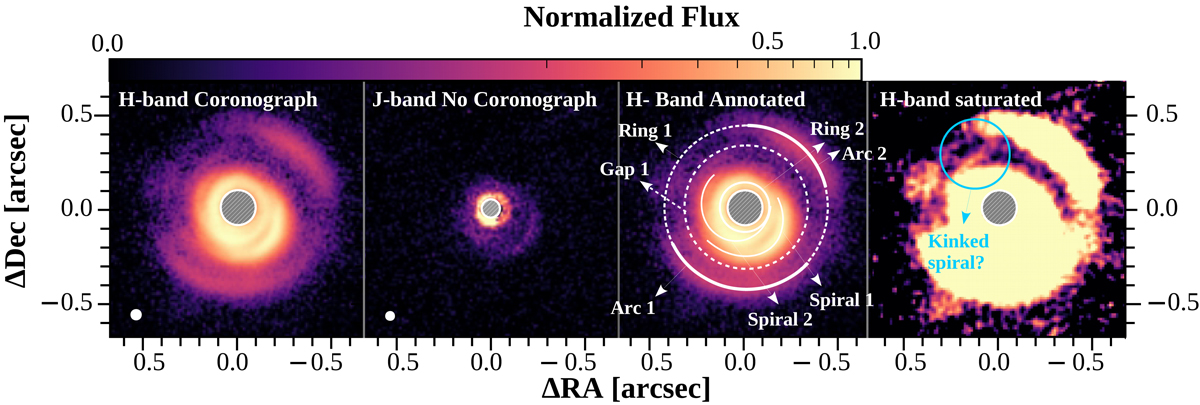
SPHERE/VLT scattered light observations of SR 21. From left to right: H-band observation with coronagraph, J-band observation without coronagraph, annotated H-band data, each normalized to its maximum flux. Rightmost panel: oversaturated cut of the r2-scaled H-band data. Shown in all cases is the Qϕ image. In the H-band epoch the gray hatched software mask indicates the coronagraph, while in J-band it indicates the inner working angle of the polarimetric observations. Indicated in both epochs is the size of one resolution element with white filled circles in the lower left corner.
Current usage metrics show cumulative count of Article Views (full-text article views including HTML views, PDF and ePub downloads, according to the available data) and Abstracts Views on Vision4Press platform.
Data correspond to usage on the plateform after 2015. The current usage metrics is available 48-96 hours after online publication and is updated daily on week days.
Initial download of the metrics may take a while.