Fig. 2.
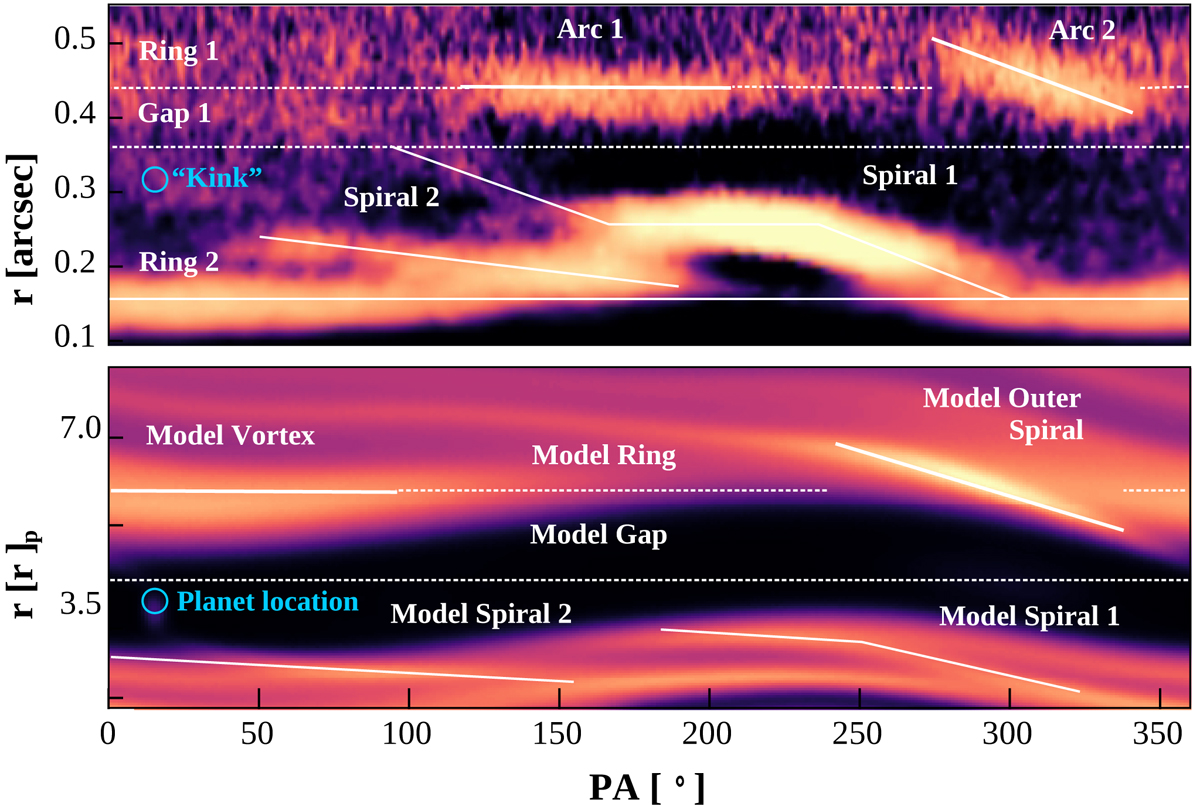
Projection of the SPHERE scattered light image into a polar coordinate system (top panel). Position angle is measured counterclockwise from the north direction. The SPHERE data was scaled by the square of the separation in order to compensate for the drop in flux due to illumination effects. We then high-pass filter prior to re-projection in order to highlight the disk features. Shown is the polar projection of the gas surface density of one of the hydrodynamical models from Pinilla et al. (2015a; bottom panel). The model assumes αturb = 10−3, planet mass ratios of 10−4 and 10−3 with respect to the central star and a ratio of orbital radii of 3.5. We show the location of the outer planet with a circle in the model image, and the location of the kinked spiral in the data in the top panel.
Current usage metrics show cumulative count of Article Views (full-text article views including HTML views, PDF and ePub downloads, according to the available data) and Abstracts Views on Vision4Press platform.
Data correspond to usage on the plateform after 2015. The current usage metrics is available 48-96 hours after online publication and is updated daily on week days.
Initial download of the metrics may take a while.