| Issue |
A&A
Volume 640, August 2020
|
|
|---|---|---|
| Article Number | A66 | |
| Number of page(s) | 9 | |
| Section | Galactic structure, stellar clusters and populations | |
| DOI | https://doi.org/10.1051/0004-6361/201937304 | |
| Published online | 12 August 2020 | |
Updated X-ray view of the Hyades cluster⋆
Hamburger Sternwarte, Universität Hamburg, 21029 Hamburg, Germany
e-mail: This email address is being protected from spambots. You need JavaScript enabled to view it.
Received:
12
December
2019
Accepted:
4
June
2020
Abstract
Aims. We revisit the X-ray properties of the main sequence Hyades members and the relation between X-ray emission and stellar rotation.
Methods. As an input catalog for Hyades members, we combined three recent Hyades membership lists derived from Gaia DR2 data that include the Hyades core and its tidal tails. We searched for X-ray detections of the main sequence Hyades members in the ROSAT all-sky survey, and pointings from ROSAT, the Chandra X-Ray Observatory, and XMM-Newton. Furthermore, we adopted rotation periods derived from Kepler’s K2 mission and other resources.
Results. We find an X-ray detection for 281 of 1066 bona fide main sequence Hyades members and provide statistical upper limits for the undetected sources. The majority of the X-ray detected stars are located in the Hyades core because of its generally smaller distance to the Sun. F- and G-type stars have the highest detection fraction (72%), while K- and M-type dwarfs have lower detection rates (22%). The X-ray luminosities of the detected members range from ∼2 × 1027 erg s−1 for late M-type dwarfs to ∼2 × 1030 erg s−1 for active binaries. The X-ray luminosity distribution functions formally differ for the members in the core and tidal tails, which is likely caused by a larger fraction of field stars in our Hyades tails sample. Compared to previous studies, our sample is slightly fainter in X-rays due to differences in the Hyades membership list used; furthermore, we extend the X-ray luminosity distribution to fainter luminosities. The X-ray activity of F- and G-type stars is well defined at FX/Fbol ≈ 10−5. The fractional X-ray luminosity and its spread increases to later spectral types reaching the saturation limit (FX/Fbol ≈ 10−3) for members later than spectral type M3. Confirming previous results, the X-ray flux varies by less than a factor of three between epochs for the 104 Hyades members with multiple epoch data, significantly less than expected from solar-like activity cycles. Rotation periods are found for 204 Hyades members, with about half of them being detected in X-rays. The activity-rotation relation derived for the coeval Hyades members has properties very similar to those obtained by other authors investigating stars of different ages.
Key words: open clusters and associations: individual: Hyades / X-rays: stars / stars: activity / stars: rotation / stars: coronae / stars: late-type
Data are only available at the CDS via anonymous ftp to cdsarc.u-strasbg.fr (130.79.128.5) or via http://cdsarc.u-strasbg.fr/viz-bin/cat/J/A+A/640/A66
© ESO 2020
1. Introduction
Open star clusters provide ideal laboratories to study the activity-rotation-age relation of late-type stars because all their members are coeval. As the nearest well-populated open cluster, the Hyades with a distance of only ∼47 pc from the Sun and an age of about 640 Myr (Lodieu et al. 2019) is of unique importance. The second Gaia data release (Gaia DR2 Gaia Collaboration 2018b, 2016), containing highly accurate parallaxes and proper motions for 1.3 billion sources and radial velocities for about 7 million sources, also significantly improves the membership identification of the Hyades. Adopting these data, Lodieu et al. (2019) present a revised census of the members of the Hyades core. According to Röser et al. (2011), Hyades members within a distance of 9 pc are gravitationally bound, but for stars at larger distances, the Galaxy exerts tidal forces leading to the creation of tidal stellar tails, which have been discovered independently by Meingast & Alves (2019) and Röser et al. (2019) using data from Gaia DR2.
The investigation of rotation periods for Hyades members has a long history and the Hyades are among the first open clusters for which photometric rotation periods were measured for low-mass stars (Radick et al. 1987, 1995). Since then, the number and quality of available rotation periods has increased substantially especially due to Kepler’s K2 mission (Howell et al. 2014). With its ∼100 deg2 field of view, Kepler targeted two slightly different parts of the Hyades in K2 Campaign 4 and 13 for about 75 days each. Douglas et al. (2016, 2019) use these K2 data to derive new rotation periods for Hyades members (for more details see Sect. 2.2).
X-ray emission from the Hyades members has been systematically investigated ever since the Einstein Observatory era (Stern et al. 1981; Micela et al. 1988). As a Hyades input catalog, Micela et al. (1988) combined 323 certain or probable Hyades members from different optical catalogs, arguing that their catalog is complete down to the ninth magnitude. Of Hyades members covered by a pointing of the Einstein Observatory, 66 of 121 are detected, and depending on the individual exposure time and the off-axis angle of the considered Hyades, Micela et al. (1988) reach detection limits of ∼2 − 7 × 1028 erg s−1 at the assumed Hyades distance of 45 pc. The first complete X-ray survey of the Hyades cluster region was performed by Stern et al. (1995) using data from the ROSAT all-sky survey (RASS). They discuss the X-ray properties of 440 optically selected Hyades members, including fainter sources than the input catalog of Micela et al. (1988). With an estimated detection limit of ∼1.5 − 3 × 1028 erg s−1 at 45 pc, Stern et al. (1995) detect 187 of their Hyades members as X-ray sources and derive upper limits for the undetected sources. ROSAT Position Sensitive Proportional Counter (PSPC) pointed observation of the Taurus-Auriga-Perseus region including the Hyades are analyzed by Stelzer & Neuhäuser (2001). Now, new data reductions for the RASS (Boller et al. 2016) and ROSAT PSPC pointed observations (ROSAT 2000) are available, and furthermore observations with XMM-Newton and the Chandra X-Ray Observatory (Weisskopf et al. 2002) provide new Hyades detections with unprecedented sensitivity and accuracy allowing us to detect sources with later spectral types and lower activity.
In this paper, we revisit the X-ray properties and the activity-rotation relation of the Hyades cluster applying current membership lists including the tidal tails, rotation periods, and significantly improved X-ray detection lists. We discuss the data acquisition in Sect. 2 describing the membership list of the Hyades in Sect. 2.1, the rotation periods in Sect. 2.2, and the X-ray observations from the different instruments in Sect. 2.3. In Sect. 3 we present our results discussing the X-ray detection rates in Sect. 3.1, the distribution of the X-ray luminosity and activity in Sect. 3.3, the variability of the Hyades members in Sect. 3.4, and the activity-rotation relation in Sect. 3.5. Finally, we draw our conclusions in Sect. 4.
2. Data acquisition
We acquired our data from different resources and created our Hyades membership list by combining recent publications from Lodieu et al. (2019), Meingast & Alves (2019), and Röser et al. (2019). To obtain the rotational properties of the Hyades members, we adopted the rotation periods from Douglas et al. (2019), who combine data from multiple studies and added further periods from Lanzafame et al. (2018). Furthermore, we crossmatched our Hyades membership list with X-ray detections from the RASS, and pointings from ROSAT, the Chandra X-Ray Observatory, and XMM-Newton.
2.1. Membership
We obtained our new Hyades member sample from three recent publications that identify Hyades members based on data from Gaia DR2. Lodieu et al. (2019) studied the central region of the Hyades and associate 710 Gaia sources with the Hyades, located within 30 pc to the cluster center; they estimate the contamination of this sample to be around 5 − 10%.
The tidal tails of the Hyades were independently discovered by Meingast & Alves (2019) and Röser et al. (2019). Both publications started from the same data, which were the Gaia DR2 sources within a 200 pc sphere around the Sun, but different selection criteria were adopted to extract the Hyades core and tidal tail members. The most important difference is that Röser et al. (2019) identified the Hyades members by applying the convergent-point method solely based on tangential velocities, while Meingast & Alves (2019) relied on 3D space velocities, excluding all sources without a radial velocity measured in Gaia DR2. However, radial velocities are only available for Gaia DR2 sources with G magnitudes between 4 and 13 mag and effective temperatures in the range of 3550–6900 K. Röser et al. (2019) subdivide their sample in the core containing sources within 18 pc around the cluster center, and they further differentiate between the leading and trailing tail selected by eye.
For the following analysis, we adopted the 979 sources from Röser et al. (2019) classified as core or tail sources and not flagged as possible interlopers. According to Röser et al. (2019), ∼1.4% and ∼13% of the sources in the core and in the tails are spuriously associated to the Hyades. Furthermore, we obtained 238 Hyades members from Meingast & Alves (2019), who do not comment on the reliability of their sample.
Combining the three Hyades catalogs, we obtained 1142 unique bona fide members. The Hertzsprung-Russell diagram (HRD) of the Hyades members selected in this way (Fig. 1) shows that most of the sources are located on the main sequence. The four Hyades giants are located well above the main sequence (and discussed in Schröder et al. 2020) and the white dwarfs are found at MG < 10 mag and BP − RP < 0 mag in the HRD. Furthermore, there are many sources that are clearly fainter than expected for main sequence stars but have red colors. We inspected these sources and found that they are only associated to the Hyades by Lodieu et al. (2019) and are excluded by Röser et al. (2019) because they do not meet the quality criteria of a small “unit weight error” and “flux excess ratio” proposed by Lindegren et al. (2018) and Gaia Collaboration (2018a). Therefore, the positions of these sources in Fig. 1 are probably wrong. In the following analysis we therefore concentrate on main sequence stars, excluding all sources that are 2.5 mag brighter or fainter than expected for dwarfs, thus obtaining our sample of 1066 bona fide Hyades members. This brightness cut excludes most of the rather peculiar red sources below the main sequence (cf., Fig. 1). We expect that the remaining sources are highly probable Hyades members thanks to their location on or very close to the Hyades main sequence, although some do not meet the formal “unit weight error” and “flux excess ratio” criteria.
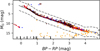 |
Fig. 1. Hertzsprung-Russell diagram of the Hyades. The red and blue sources indicate Hyades members in the core and in the tails, respectively. The orange sources are only associated to the Hyades by Lodieu et al. (2019), sources outlined in black are detected X-rays. The theoretical main sequence adopted from Worthey & Lee (2011) is shown by the black solid line, while the dashed lines indicate the values 2.5 mag brighter and fainter than the main sequence. |
In Table 1 we list the catalogs providing the Hyades members. To distinguish between core and tidal tails, we applied the condition of Röser et al. (2019) and classify Hyades member within 18 pc of the cluster center as core sources and members with larger distances as tidal tail sources, adopting the position of the cluster center from Lodieu et al. (2019). Thus, 550 Hyades are associated with the core and 516 with the tidal tails. In Fig. 2 we show the spatial distribution of the Hyades members discussed in this paper in Galactic Cartesian coordinates, where the X and Y axes are directed to the Galactic center and in the direction of the Galactic rotation, respectively. Most core sources have similar distances, some tail members are in the immediate solar vicinity, most tail members, however, have much larger distances than the Hyades core.
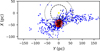 |
Fig. 2. Hyades members in Galactic Cartesian XY coordinates. The red and blue sources are associated with the cluster’s core and tidal tails, respectively. Sources outlined in black are detected in X-rays. The star marker indicates the position of the sun and the dashed and dotted lines show 35 pc and 60 pc radius around the sun, respectively. |
Catalogs of the Hyades.
2.2. Rotation periods
Douglas et al. (2019) provide rotation periods for Hyades members derived from K2 Campaign 13 light curves. Additionally, they adopt rotation periods from Douglas et al. (2016) estimated from K2 Campaign 4 data as well as periods from Radick et al. (1987, 1995), Prosser et al. (1995), Hartman et al. (2011), and Delorme et al. (2011), and from data of the All Sky Automated Survey (ASAS, Pojmanski 2002). We searched Table 3 of Douglas et al. (2019) for matches with our membership list and adopted 191 proposed rotation periods. For 13 Hyades members not listed by Douglas et al. (2019), we found a rotation period in Lanzafame et al. (2018) who analyze photometric time series from Gaia data (released within DR2). Thus in total we have rotation periods for 204 Hyades members. Since Douglas et al. (2019) only investigate the Hyades core, the great majority of the stars with periods are located in the core and only seven of the tail members have known periods.
In Fig. 3 we show the rotation periods as a function of the BP − RP color. From F-type to early M-type stars, the sources follow the slow-rotator sequence with a steady increase in the rotation period to later spectral types. There are a few outliers with smaller periods; these sources are probably binaries. The rotation period abruptly drops at BP − RP ≈ 2.5 mag near the boundary to fully convective stars (compare to Douglas et al. (2019)). The X-ray detected Hyades are marked with black symbols in Fig. 3 and we discuss their properties in Sect. 3.5.
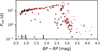 |
Fig. 3. Rotation periods of the Hyades as a function of the BP − RP color. The red and blue sources are associated to the core and the tidal tails, respectively. Sources outlined in black are detected in X-rays. |
2.3. X-ray observations
We adopted the X-ray properties by crossmatching the Hyades members with the second ROSAT all-sky survey (2RXS) source catalog (Boller et al. 2016), the second ROSAT PSPC catalog (release 2.1.0 ROSAT 2000) (2RXP), the ROSAT High Resolution Imager (HRI) pointed observations (3rd release ROSAT Scientific Team 2000) (1RXH), the Chandra Source Catalog (specifically CSC release 2.0 Evans et al. 2010), and pointed XMM-Newton observations that contain a Hyades member. For sources with multiple detections, we adopted the X-ray data derived from XMM-Newton data or from the CSC if available, and otherwise the ROSAT observation with the longest exposure time. To make the measurements of the different instruments comparable, we converted all X-ray fluxes into the XMM-Newton band (0.2 − 12 keV), adopting an Astrophysical Plasma Emission Code (APEC) thermal plasma model with a temperature of log(T) = 6.5 and solar metallicity; we also estimated upper limits for the undetected sources using this plasma emission model. We note that we derived these upper limits only in a statistical way, not individually using the actual photon counts; for any given star, an actual upper limit might be higher, if, for example, a nearby source is present, or lower if the background is exceptionally low. Our upper limits therefore characterize the properties of our Hyades sample. We did compare our upper limits with those given by Stern et al. (1995) and found in most cases our values to be rather conservative. Hence, we are confident that our upper limits are reliable for most Hyades members.
2.3.1. ROSAT all-sky survey
Between August 1990 and January 1991 the RASS was performed (Truemper 1982). Boller et al. (2016) re-processed the data from this survey and created the 2RXS catalog. We adopted the 2RXS identifications of the Hyades members from Freund et al. (in prep.), considering only those members that are the most likely counterpart to the 2RXS source and have an individual matching probability p(Hlj) > 50%.
In contrast to pointed observations, the RASS covers the entire region of the Hyades, and hence, upper limits of the X-ray luminosity can be derived for all undetected Hyades members. To estimate the minimal number of counts that are detectable in the RASS, we inspected the number of detected counts as a function of exposure time for all 2RXS detections as shown in Fig. 4. We fitted a lower envelope to the distribution using a quadratic polynomial so that 95 % of the sources are located above the envelope. Then, we applied the RASS exposure time at the position of every undetected Hyades member and the lower envelope to estimate the minimal number of counts that would have resulted in an X-ray detection, and thus, the upper limit of the count rate and the X-ray luminosity.
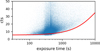 |
Fig. 4. Number of counts as a function of the exposure time for all 2RXS sources. The solid red curve represents the lower envelope (95% of the sources lie above the line). |
2.3.2. ROSAT pointings
After the all-sky survey, ROSAT performed pointed observations until the end of the mission in February 1998. For these observations two different instruments were available: the Position Sensitive Proportional Counter (PSPC) and the High Resolution Imager (HRI). The results are available in the 2RXP (ROSAT 2000) and 1RXH (ROSAT Scientific Team 2000) catalogs, respectively.
We crossmatched the Hyades member list with the 2RXP and 1RXH catalogs, applying a matching radius of 3σ of the stated X-ray positional uncertainty, excluding all 2RXP and 1RXH sources with no exposure time and 1RXH sources flagged as non-unique. No positional and count rate errors are given for 21% of the 2RXP sources detected at an off-axis angle larger than 20 arcmin to the center of the field of view. For these sources, we estimated the positional uncertainty considering the width of the point spread function (PSF) of the Gaussian intrinsic resolution and the mirror blur1 through
 (1)
(1)
where cts is the number of source counts, θ is the off-axis angle in degrees, and for the source energy, we adopted a constant value of E = 0.2 keV. For the 2RXP and 1RXH sources with a formal statistical uncertainty < 5 arcsec, we applied a value of 5 arcsec to account for systematic errors. Some Hyades members are counterparts to multiple 2RXP or 1RXH sources. Here, we calculated the weighted mean of the count rates from all 2RXP or 1RXH sources because they are likely detections of the same X-ray source.
For the Hyades members covered by a 2RXP or 1RXH pointing and not detected in any of the X-ray catalogs, we estimated upper limits. We adopted a circular field of view with a diameter of 2° and 38 arcmin for the 2RXP and 1RXH pointings, respectively, neglecting the ribs of the PSPC and the square field of view of the HRI. We estimated the minimal number of detectable counts as a function of the exposure time in a similar way to that described in Sect. 2.3.1. However, since the width of the PSF strongly increases with the off-axis angle, we applied different lower envelopes to 2RXP sources depending on their off-axis angle. We derive 2RXP upper limits only for Hyades members within 50 arcmin to the center of a 2RXP pointing because the number and quality of sources detected at larger angular separations is too low to fit a lower envelope and derive meaningful upper limits.
2.3.3. Chandra pointings
The Chandra X-Ray Observatory has been performing pointed observations since its launch in 1999 (Weisskopf et al. 2002). Two different instruments, the Advanced CCD Imaging Spectrometer (ACIS) and the High Resolution Camera (HRC), are available for the observations. The CSC 2.0 provides information on about 370 000 unique sources detected in more than 10 000 Chandra observations with the ACIS and HRC instruments; this information was made publicly available by the end of 2014. Pointings covering the same position were stacked to determine unique sources. In the region of the Hyades, Chandra pointings cover a region of about 0.70 deg2 in the core and 0.47 deg2 in the tails. We searched in the CSC for counterparts and upper limits to our Hyades members, adopted a matching radius of 3σ of the Chandra positional uncertainties, and applied a minimal uncertainty of 1 arcsec to account for systematic errors. We did not search for individual observations. The CSC provides X-ray fluxes estimated from an APEC model and we adopted these values after converting the flux of the broad bands of the ACIS and HRC instruments to the XMM band.
2.3.4. XMM-Newton pointings
We inspected all XMM-Newton observations with a Hyades member that were within 10 arcmin of the nominal aim point of the X-ray observation covering a region of about 6.7 and 1.2,deg2 of the Hyades core and tails, respectively. If the source fell onto one of the three X-ray detectors, we extracted the source and background counts within 10 and 20 arcsec from the proper-motion-corrected position on the detector(s). If the number of counts in any of the two considered radii was above the 99% interval for random background fluctuations, we considered the source as potentially detected. In that case, we considered all Gaia DR2 sources that fell within 20 arcsec of the Hyades member under consideration and checked if any of these potential alternative sources provided a better match with the X-ray photon distribution. For example, if the centroid matched better with any of the alternative sources, we manually checked whether the Hyades member was indeed the best matching counterpart (see Schneider et al, in prep. for details).
Hyades members that are detected by XMM-Newton were then checked against source variability during the observation and the source count rate was converted into flux using the encircled energy fraction, the effective exposure at the detector position, and assuming a plasma temperature of log(T) = 6.5 as used for the ROSAT conversion factor.
3. X-ray and rotational properties of the Hyades
In Table 2 we provide the number of Hyades detections, unique sources, and data adopted for the following analysis for the individual X-ray catalogs as well as the number of upper limits and number of lowest upper limits from all X-ray catalogs. In total, 281 Hyades members are detected as X-ray sources. In the following, we discuss the X-ray detection rate and the X-ray and rotational properties of the Hyades members in detail.
Catalogs of the X-ray data for the Hyades.
3.1. X-ray detection rates
Most of the detections (212) and upper limits from pointed observations (77) are located in the core of the Hyades, while only 69 and 30 detections and upper limits are found in the tidal tails. The reason for the smaller number of detections in the tails is the generally larger distance of the tail sources. As evident in Fig. 2, most of the detected tail sources are rather close to the Sun and only a very few Hyades members are detected at larger distances. Furthermore, the central part of the Hyades cluster is much better covered by pointed X-ray observations. To further investigate the influence of the source distances on the detection fractions, we sorted the Hyades members into three groups according to their distance. The first group contains 65 sources closer than 35 pc to the Sun, with 5 sources being associated to the core and the remaining 60 to the tidal tails. The second group contains stars with distances between 35 and 60 pc and covers the center of the Hyades; hence 526 of the so-selected 669 sources are classified as core sources, while 143 objects belong to the tidal tails. The third group of stars with distances larger than 60 pc contains more sources in the tails (313), while only 19 are classified as core sources.
In Table 3 we provide the detection fractions of the different samples. As expected, the sample with the largest distance has the lowest detection fraction and the closest group has the highest detection fraction. Furthermore, the detection fraction depends on the spectral type (as adopted from the BP − RP color). While the largest detection fractions are obtained for F- and G-type stars, the detection fraction drops for K- and M-type members due to the X-ray luminosity distributions of the different spectral types (cf., Sect. 3.3). We find no X-ray emitting A-type Hyades members, confirming the fact that A-type stars are in general not strong X-ray sources (Schmitt 1997).
X-ray detections of the Hyades with different distances to the Sun.
We find 291 of the 440 sources analyzed by Stern et al. (1995) in our sample of Hyades dwarfs (a further 34 members in Stern et al. (1995) have an identification in our Hyades catalog, but are not located on the main sequence). Stern et al. (1995) identify 111 sources with a RASS counterpart and we add a further 56 X-ray identifications of these sources. On the other hand, we do not find a reliable X-ray identification for 10 Hyades members reported by Stern et al. (1995) for various reasons; in some cases the angular separation between the Hyades member and the RASS counterpart is quite large and therefore we deem the identification as unreliable, or there is a better counterpart to the RASS source, either a binary companion or a background source unrelated to the Hyades cluster. A few RASS sources found by Stern et al. (1995) are not part of the 2RXS catalog that we use for our study.
3.2. Spurious identifications
Freund et al. (in prep.) provide matching probabilities for all 2RXS identifications of the Hyades members. Thus, we expect 13 of the 191 2RXS identifications to be spurious associations, however, the estimation of the matching probability does not consider that we know a priori Hyades members to be likely identifications. Hence, we expect the estimated number to be an upper bound.
To estimate the number of random 2RXP, 1RXH, XMM, and CSC associations, we randomly shifted all Hyades members several times between 3 and 10 arcmin and by a random angle, and performed the same matching procedure for the shifted as for the real Hyades members. On average, we obtained 2.2 2RXP and 0.2 1RXH identifications to the shifted Hyades members and we expect a similar number of random associations for the real Hyades members. The probability of a chance alignment for XMM and CSC counterparts is thus very low (< 1 spurious counterparts in our sample) according to our tests.
3.3. X-ray activity and Hertzsprung-Russell diagram
In Figs. 5 and 6 we show the fractional X-ray fluxes FX/Fbol2 and X-ray luminosities LX of the main sequence Hyades members as a function of the BP − RP color. The activity distribution of the F- and G-type stars is quite well defined, but the spread in fractional X-ray luminosity increases for later spectral types, reaching a maximum for K- and early M-type sources. Nevertheless, the X-ray activity (as measured by FX/Fbol) continuously increases toward later spectral types, from log(FX/Fbol)≈ − 5.7 for early F-type stars to the saturation limit at log(FX/Fbol) ≈ − 3 for sources later than approximately spectral type M3 (Vilhu 1984; Agrawal et al. 1986; Fleming et al. 1988; Pallavicini et al. 1990). Some sources at late spectral types are detected above the saturation limit, which we tentatively attribute to flares.
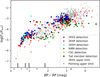 |
Fig. 5. X-ray to bolometric flux distribution of the Hyades as a function of the BP − RP color. Blue, red, cyan, green, and orange dots indicate the values adopted from 2RXS, 2RXP, 1RXH, XMM, and CSC, respectively, while the triangles show the upper limits from 2RXP, 1RXH, and XMM pointings. The upper limits from 2RXS are shown as gray triangles in the background. In contrast to the detections in the core, the Hyades members in the tails are outlined in black. At the bottom we show the ranges of the spectral types as a guidance. |
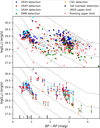 |
Fig. 6. X-ray luminosities of the Hyades as a function of the BP − RP color. The color coding is the same as in Fig. 5. From top to bottom, the dashed lines indicate activity levels of LX/Lbol = −2, −3, −4, −5, −6, and −7 for sources located on the main sequence. The upper panel shows the best X-ray luminosity for the individual Hyades members, while the bottom panel compares the X-ray luminosities measured by different instruments or pointings for multiple detected sources. Detections of the same source are connected by a string. |
In Fig. 6 some early K-type sources with X-ray luminosities higher than LX = 5 × 1029 erg s−1 stand out particularly. These sources are X-ray bright, active binaries like RS CVn systems; close binaries are known to be very active in X-rays because they maintain their high rotation periods due to tidal interaction (Walter et al. 1978; Dempsey et al. 1993, 1997). On the other hand, Fig. 6 includes three upper limits with LX ≲ 1027 erg s−1, which would be highly surprising given the age of the Hyades members. We inspected these sources in detail and found that one data point (Gaia DR2 3312602348628348032 at BP − RP = 1.1 mag) is probably erroneously an upper limit as a likely counterpart is just outside the positional error region (reasonable given the number of X-ray detections). The two other low upper limits (at BP − RP = 1.9 and 2.7 mag) are likely indicative of the fact that these sources are not genuine Hyades members (specifically Gaia DR2 3189577958236917632 and 45770783575075968), which we regard as compatible with the estimated contamination fraction in the membership list of several percent.
After excluding these three upper limits, the faintest Hyades members detected with XMM-Newton have X-ray luminosities that are similar to the lowest upper limits. Hence, we conclude that all main sequence Hyades stars with a convection zone can be detected in X-rays at sensitivities reachable with XMM-Newton, with the only exception possibly being the latest M-type stars.
In Fig. 7 we compare the X-ray luminosity distributions of the core and tail members of the Hyades for different spectral types and show the distributions resulting from the data by Stern et al. (1995) as comparison; we used the Kaplan-Meier estimator to include upper limits, which is of particular importance because the detection limits of the tail sources are higher than in the core due to their generally larger distances. As visible in Fig. 7, the earlier type stars have a steeper X-ray luminosity distribution, and we note the different scaling of the x-axis in the upper panels. For most spectral types, the core members are slightly brighter than the members in the Hyades tails. According to a logrank test, the X-ray luminosity distributions of the core and tail members differ with a high significance. However, this does not necessarily mean that the X-ray properties of the Hyades core and tail members differ intrinsically, instead the difference is probably caused by a larger fraction of field stars spuriously associated with the Hyades tidal tails as discussed by Röser et al. (2019). Even our core members are fainter than the sample presented by Stern et al. (1995). The deviations are mainly caused by the different Hyades membership lists; for example, four of the five brightest F-type X-ray emitters in Stern et al. (1995) are not associated to the Hyades according to the Gaia DR2 data that we use. However, due to the detections from pointed observations especially with XMM-Newton, we can extend the X-ray luminosity distribution to fainter luminosities, which is particularly important for the K- and M-type Hyades members.
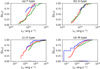 |
Fig. 7. Kaplan-Meier estimator of the X-ray luminosities for the Hyades members at different spectral types. The red, blue, and green lines show the survival functions for the core and tail members and for the sample from Stern et al. (1995), respectively. The colored bars at the x-axis indicate the upper limits |
3.4. Variability
X-ray luminosities from different epochs are available for 104 Hyades members detected by different instruments or by the same instrument in different pointings. In the bottom panel of Fig. 6 and in Fig. 8, we compare the X-ray luminosities of the various detections. We do not include upper limits because our upper limits are suited to describe the properties of samples but they might be unreliable for individual sources. Although the observations are up to 25 years apart, in most cases the X-ray luminosities measured for each source do not differ by more than a factor of three. Hence we conclude that the Hyades members are not strongly affected by activity cycles compared to the Sun, whose X-ray luminosity differs by more than one order of magnitude between solar minimum and maximum (Peres et al. 2000) in a comparable energy band.
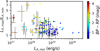 |
Fig. 8. Fraction of the maximal to minimal measured X-ray luminosity for multiple detected Hyades members. The color scales with the BP − RP color. No error is given for 2RXP sources detected at an off-axis angle larger than 20 arcmin to the center of the pointing. |
Hyades members that show larger differences between epochs are particularly red and, therefore, low-mass stars. These stars are generally more active and therefore show more frequent flaring. Such stochastic flares can increase the X-ray flux by a factor of more than 100 (e.g., Stelzer et al. 2006). Hence, the larger differences in the X-ray fluxes derived at two epochs are likely caused by different degrees of flaring activity.
This agrees well with the results reported by Stern et al. (1995), who find most of the Hyades members to vary by not more than a factor of two and attributed most of the larger variations to flares. Similarly, Micela et al. (1996) find a variability by a factor of two for only about 15% of the much younger Pleiades members; thus X-ray flaring does not corrupt these cross-mission comparisons.
3.5. Rotation properties
Out of 204 Hyades members with measured rotation periods, 103 are detected in X-rays. As shown in Fig. 3, the detection fraction generally decreases with increasing rotation period. Hence, most of the potential binaries located below the slow-rotator sequence and many of the earlier fully convective stars are detected in X-rays. However, despite their short rotation periods, the detection fraction decreases for the latest spectral types because of their low bolometric luminosities.
For the Hyades members with known rotation periods, we estimated the Rossby number by adopting empirical convective turnover times provided by Eq. (5) in Wright et al. (2018), which is an improved version of Eq. (10) from Wright et al. (2011). However, for four Hyades members with known rotation periods, the color is outside the range in which the correlation from Wright et al. (2018) is valid. In Fig. 9 the X-ray activity as measured by FX/Fbol is plotted as a function of the Rossby number. Most sources with log(Ro)≲ − 1.0 are saturated; these sources are generally the later type stars. The activity linearly decreases for larger Rossby numbers and stars of earlier spectral types also have larger Rossby numbers; we note that the outlier, which is saturated but has a small Rossby number, is a binary of Algol type.
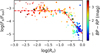 |
Fig. 9. X-ray activity as a function of the Rossby number for Hyades members with known rotation period. The dots indicate sources detected in X-rays, while the triangles show upper limits. In contrast to the sources in the core, the Hyades members in the tails are outlined in black. The color scales with the BP − RP color. The red dashed line indicates the best fit. |
Following Pizzolato et al. (2003) and Wright et al. (2011, 2018), we fit the relationship between the activity indicator RX = log(FX/Fbol) and the Rossby number Ro by the ansatz
 (2)
(2)
where RX, sat is the saturation limit, Ro, sat is the Rossby number at the saturation threshold to the saturation regime, β is the power-law index, and the constant is given by C = RX, sat − log(Ro, sat)⋅β. We applied the method of least squares to the detections in Fig. 9 excluding the outlier and found a saturation limit of RX, sat = −3.21 ± 0.16, a break value between saturated and unsaturated sources at log(Ro, sat) = − 0.84 ± 0.18, and a power law index of β = −2.12 ± 0.60. Unlike Wright et al. (2011), we did not explicitly exclude flares from our sample, nevertheless, the break value to the saturation regime and saturation limit of the X-ray activity from our Hyades sample is very similar to the values obtained by Wright et al. (2011). Therefore, we conclude again that the X-ray detections of the Hyades members are not strongly biased by flares. We find a power-law index that is slightly steeper than the canonical value of β = −2 but the canonical value and the value from Wright et al. (2011) are within the error margins.
4. Conclusion
In this paper we present an update on the X-ray and rotational properties of the Hyades. Using membership criteria based upon the recent Gaia DR2 release, we create a membership list containing 1066 main sequence Hyades stars both in the core and in the tidal tails of the Hyades cluster. Using all available X-ray data, we detect 281 Hyades members (∼26%) as X-ray sources, which is a significant increase compared to 139 unique Hyades detections reported by Stelzer & Neuhäuser (2001) and 187 unique Hyades members reported by Stern et al. (1995); we note that due to differences in the Hyades membership list, the RASS data reduction, and the identification procedure, we only have 111 sources in common with Stern et al. (1995).
Confirming earlier results from Micela et al. (1988) and Stern et al. (1995), we find the highest detection fractions for F- and G-type stars, while the detection fraction decreases for K- and M-type members. We specifically detect Hyades members with X-ray luminosities in the range from ∼2 × 1027 erg s−1 to ∼2 × 1030 erg s−1 covering three orders of magnitude. The brightest sources are active binaries, while late M-type dwarfs reach the lowest X-ray luminosities. The X-ray luminosity distributions of F- and G-type members are much steeper than for K- and M-type dwarfs. Compared to Stern et al. (1995), we extend the distributions of the latest spectral types to lower luminosities. Since we do not find meaningful upper limits below 1 × 1027 erg s−1, we expect that all Hyades members with a convection zone are actually detectable with sufficiently long XMM-Newton exposures. Furthermore, the upcoming eROSITA all-sky survey (Merloni et al. 2012, eRASS) is expected to provide nearly complete X-ray detections for the Hyades members, at least in the core. The observed X-ray activity ranges from log(FX/Fbol)≈ − 5.7 for early F-type sources and continuously increases for decreasing spectral type reaching the saturation limit at log(FX/Fbol)≈ − 3 for sources later than spectral type M3. Stars of types F and G show the smallest spread in their X-ray luminosities, however, the intrinsic spread increases for K- and M-type sources just like the spread in the observed rotation periods. For 104 Hyades members, we find multiple detections either by different instruments or in different pointings. Similarly to Stern et al. (1995) who compare X-ray luminosities from Einstein and RASS, we do not find strong variations attributable to solar-like activity cycles, although the observations have different time intervals with a maximum baseline of 25 years. Only a few Hyades members show variations larger than a factor of three and these sources are all M-type dwarfs, where flares are probably responsible for the variation.
For the first time, we analyze the X-ray properties of the Hyades tidal tails. The X-ray detection fraction is lower in the tails because of generally larger source distances. The X-ray luminosity distributions formally differ between the core and tails of the Hyades, however, this difference does not necessarily argue against their common origin but is likely caused by a higher contamination of field stars in the tail member sample. The now running eROSITA all-sky survey is expected to provide far more detections among the tidal tail members and will therefore allow a far more detailed comparison between core and tails.
We find rotation periods for 204 of our bona fide Hyades members, 103 of them (∼50%) are detected in X-rays, and Rossby numbers can be estimated. In an activity-rotation diagram, the linear increase of activity with decreasing Rossby number for slow rotators is visible as well as the saturation limit for the fast rotators. For the Hyades, sources with high and low Rossby numbers differ mainly by spectral type, however, the parameters of the activity-rotation relation are very similar to those obtained by Wright et al. (2011, 2018) who applied sources of different ages. The ongoing Transiting Exoplanet Survey Satellite (TESS) mission will significantly improve on the number of available rotation periods for Hyades members and thus again allow for a more detailed comparison between core and tails.
For the bolometric correction and the conversion between the BP − RP and other photometric colors, throughout this pape we adopted the values given in a table based on Pecaut & Mamajek (2013) available at http://www.pas.rochester.edu/~emamajek/EEM_dwarf_UBVIJHK_colors_Teff.txt (Version 2019.3.22).
Acknowledgments
SF acknowledges supports through the Integrationsamt Hildesheim, the ZAV of Bundesagentur für Arbeit, and Hamburg University, JR acknowledges support by DLR under grant 50 QR 1605, and PCS through the SFB 676 founded by DFG and by DLR under grant 50 OR 1901. SF thanks Gabriele Uth and Maria Theresa Sangdaan-Lehmann for their support. This work has made use of data from the European Space Agency (ESA) mission Gaia (https://www.cosmos.esa.int/gaia), processed by the Gaia Data Processing and Analysis Consortium (DPAC, https://www.cosmos.esa.int/web/gaia/dpac/consortium). Funding for the DPAC has been provided by national institutions, in particular the institutions participating in the Gaia Multilateral Agreement. The paper is based on observations obtained with XMM-Newton, an ESA science mission with instruments and contributions directly funded by ESA Member States and NASA. This research has made use of data obtained from the Chandra Source Catalog, provided by the Chandra X-ray Center (CXC) as part of the Chandra Data Archive. This paper includes data collected by the K2 mission. Funding for the K2 mission was provided by the NASA Science Mission directorate. We used the VizieR catalog access tool and the SIMBAD database, operated at CDS, Strasbourg, France. The original description of the VizieR service was published in A&AS 143, 23.
References
- Agrawal, P. C., Rao, A. R., & Sreekantan, B. V. 1986, MNRAS, 219, 225 [NASA ADS] [CrossRef] [Google Scholar]
- Boller, T., Freyberg, M. J., Trümper, J., et al. 2016, A&A, 588, A103 [NASA ADS] [CrossRef] [EDP Sciences] [Google Scholar]
- Delorme, P., Collier Cameron, A., Hebb, L., et al. 2011, MNRAS, 413, 2218 [NASA ADS] [CrossRef] [Google Scholar]
- Dempsey, R. C., Linsky, J. L., Fleming, T. A., & Schmitt, J. H. M. M. 1993, ApJS, 86, 599 [NASA ADS] [CrossRef] [Google Scholar]
- Dempsey, R. C., Linsky, J. L., Fleming, T. A., & Schmitt, J. H. M. M. 1997, ApJ, 478, 358 [NASA ADS] [CrossRef] [Google Scholar]
- Douglas, S. T., Agüeros, M. A., Covey, K. R., et al. 2016, ApJ, 822, 47 [NASA ADS] [CrossRef] [Google Scholar]
- Douglas, S. T., Curtis, J. L., Agüeros, M. A., et al. 2019, ApJ, 879, 100 [NASA ADS] [CrossRef] [Google Scholar]
- Evans, I. N., Primini, F. A., Glotfelty, K. J., et al. 2010, ApJS, 189, 37 [NASA ADS] [CrossRef] [EDP Sciences] [Google Scholar]
- Fleming, T. A., Liebert, J., Gioia, I. M., & Maccacaro, T. 1988, ApJ, 331, 958 [NASA ADS] [CrossRef] [Google Scholar]
- Gaia Collaboration (Prusti, T., et al.) 2016, A&A, 595, A1 [NASA ADS] [CrossRef] [EDP Sciences] [Google Scholar]
- Gaia Collaboration (Brown, A. G. A., et al.) 2018a, A&A, 616, A1 [NASA ADS] [CrossRef] [EDP Sciences] [Google Scholar]
- Gaia Collaboration (Babusiaux, C., et al.) 2018b, A&A, 616, A10 [NASA ADS] [CrossRef] [EDP Sciences] [Google Scholar]
- Hartman, J. D., Bakos, G. Á., Noyes, R. W., et al. 2011, AJ, 141, 166 [NASA ADS] [CrossRef] [Google Scholar]
- Howell, S. B., Sobeck, C., Haas, M., et al. 2014, PASP, 126, 398 [NASA ADS] [CrossRef] [Google Scholar]
- Lanzafame, A. C., Distefano, E., Messina, S., et al. 2018, A&A, 616, A16 [Google Scholar]
- Lindegren, L., Hernández, J., Bombrun, A., et al. 2018, A&A, 616, A2 [NASA ADS] [CrossRef] [EDP Sciences] [Google Scholar]
- Lodieu, N., Smart, R. L., Pérez-Garrido, A., & Silvotti, R. 2019, A&A, 623, A35 [NASA ADS] [CrossRef] [EDP Sciences] [Google Scholar]
- Meingast, S., & Alves, J. 2019, A&A, 621, L3 [NASA ADS] [CrossRef] [EDP Sciences] [Google Scholar]
- Merloni, A., Predehl, P., Becker, W., et al. 2012, ArXiv e-prints [arXiv:1209.3114] [Google Scholar]
- Micela, G., Sciortino, S., Vaiana, G. S., et al. 1988, ApJ, 325, 798 [NASA ADS] [CrossRef] [Google Scholar]
- Micela, G., Sciortino, S., Kashyap, V., Harnden, F. R. J., & Rosner, R. 1996, ApJS, 102, 75 [NASA ADS] [CrossRef] [Google Scholar]
- Pallavicini, R., Tagliaferri, G., & Stella, L. 1990, A&A, 228, 403 [NASA ADS] [Google Scholar]
- Pecaut, M. J., & Mamajek, E. E. 2013, ApJS, 208, 9 [Google Scholar]
- Peres, G., Orlando, S., Reale, F., Rosner, R., & Hudson, H. 2000, ApJ, 528, 537 [NASA ADS] [CrossRef] [Google Scholar]
- Pizzolato, N., Maggio, A., Micela, G., Sciortino, S., & Ventura, P. 2003, A&A, 397, 147 [NASA ADS] [CrossRef] [EDP Sciences] [Google Scholar]
- Pojmanski, G. 2002, Acta Astron., 52, 397 [NASA ADS] [Google Scholar]
- Prosser, C. F., Shetrone, M. D., Dasgupta, A., et al. 1995, PASP, 107, 211 [NASA ADS] [CrossRef] [Google Scholar]
- Radick, R. R., Thompson, D. T., Lockwood, G. W., Duncan, D. K., & Baggett, W. E. 1987, ApJ, 321, 459 [NASA ADS] [CrossRef] [Google Scholar]
- Radick, R. R., Lockwood, G. W., Skiff, B. A., & Thompson, D. T. 1995, ApJ, 452, 332 [NASA ADS] [CrossRef] [EDP Sciences] [Google Scholar]
- ROSAT, Consortium 2000, VizieR Online Data Catalog, IX/30 [Google Scholar]
- ROSAT Scientific Team 2000, VizieR Online Data Catalog, IX/28A [Google Scholar]
- Röser, S., Schilbach, E., Piskunov, A. E., Kharchenko, N. V., & Scholz, R. D. 2011, A&A, 531, A92 [NASA ADS] [CrossRef] [EDP Sciences] [Google Scholar]
- Röser, S., Schilbach, E., & Goldman, B. 2019, A&A, 621, L2 [NASA ADS] [CrossRef] [EDP Sciences] [Google Scholar]
- Schmitt, J. H. M. M. 1997, A&A, 318, 215 [NASA ADS] [Google Scholar]
- Schröder, K.-P., Mittag, M., Jack, D., Rodriguez Jimenez, A., & Schmitt, J. H. M. M. 2020, MNRAS, 492, 1110 [CrossRef] [Google Scholar]
- Stelzer, B., & Neuhäuser, R. 2001, A&A, 377, 538 [NASA ADS] [CrossRef] [EDP Sciences] [Google Scholar]
- Stelzer, B., Schmitt, J. H. M. M., Micela, G., & Liefke, C. 2006, A&A, 460, L35 [NASA ADS] [CrossRef] [EDP Sciences] [Google Scholar]
- Stern, R. A., Zolcinski, M. C., Antiochos, S. K., & Underwood, J. H. 1981, ApJ, 249, 647 [NASA ADS] [CrossRef] [Google Scholar]
- Stern, R. A., Schmitt, J. H. M. M., & Kahabka, P. T. 1995, ApJ, 448, 683 [Google Scholar]
- Truemper, J. 1982, Adv. Space Res., 2, 241 [NASA ADS] [CrossRef] [Google Scholar]
- Vilhu, O. 1984, A&A, 133, 117 [NASA ADS] [Google Scholar]
- Walter, F., Charles, P., & Bowyer, S. 1978, ApJ, 225, L119 [NASA ADS] [CrossRef] [Google Scholar]
- Weisskopf, M. C., Brinkman, B., Canizares, C., et al. 2002, PASP, 114, 1 [NASA ADS] [CrossRef] [Google Scholar]
- Worthey, G., & Lee, H.-C. 2011, ApJS, 193, 1 [NASA ADS] [CrossRef] [EDP Sciences] [Google Scholar]
- Wright, N. J., Drake, J. J., Mamajek, E. E., & Henry, G. W. 2011, ApJ, 743, 48 [NASA ADS] [CrossRef] [Google Scholar]
- Wright, N. J., Newton, E. R., Williams, P. K. G., Drake, J. J., & Yadav, R. K. 2018, MNRAS, 479, 2351 [NASA ADS] [CrossRef] [Google Scholar]
All Tables
All Figures
|
Fig. 1. Hertzsprung-Russell diagram of the Hyades. The red and blue sources indicate Hyades members in the core and in the tails, respectively. The orange sources are only associated to the Hyades by Lodieu et al. (2019), sources outlined in black are detected X-rays. The theoretical main sequence adopted from Worthey & Lee (2011) is shown by the black solid line, while the dashed lines indicate the values 2.5 mag brighter and fainter than the main sequence. |
| In the text | |
|
Fig. 2. Hyades members in Galactic Cartesian XY coordinates. The red and blue sources are associated with the cluster’s core and tidal tails, respectively. Sources outlined in black are detected in X-rays. The star marker indicates the position of the sun and the dashed and dotted lines show 35 pc and 60 pc radius around the sun, respectively. |
| In the text | |
|
Fig. 3. Rotation periods of the Hyades as a function of the BP − RP color. The red and blue sources are associated to the core and the tidal tails, respectively. Sources outlined in black are detected in X-rays. |
| In the text | |
|
Fig. 4. Number of counts as a function of the exposure time for all 2RXS sources. The solid red curve represents the lower envelope (95% of the sources lie above the line). |
| In the text | |
|
Fig. 5. X-ray to bolometric flux distribution of the Hyades as a function of the BP − RP color. Blue, red, cyan, green, and orange dots indicate the values adopted from 2RXS, 2RXP, 1RXH, XMM, and CSC, respectively, while the triangles show the upper limits from 2RXP, 1RXH, and XMM pointings. The upper limits from 2RXS are shown as gray triangles in the background. In contrast to the detections in the core, the Hyades members in the tails are outlined in black. At the bottom we show the ranges of the spectral types as a guidance. |
| In the text | |
|
Fig. 6. X-ray luminosities of the Hyades as a function of the BP − RP color. The color coding is the same as in Fig. 5. From top to bottom, the dashed lines indicate activity levels of LX/Lbol = −2, −3, −4, −5, −6, and −7 for sources located on the main sequence. The upper panel shows the best X-ray luminosity for the individual Hyades members, while the bottom panel compares the X-ray luminosities measured by different instruments or pointings for multiple detected sources. Detections of the same source are connected by a string. |
| In the text | |
|
Fig. 7. Kaplan-Meier estimator of the X-ray luminosities for the Hyades members at different spectral types. The red, blue, and green lines show the survival functions for the core and tail members and for the sample from Stern et al. (1995), respectively. The colored bars at the x-axis indicate the upper limits |
| In the text | |
|
Fig. 8. Fraction of the maximal to minimal measured X-ray luminosity for multiple detected Hyades members. The color scales with the BP − RP color. No error is given for 2RXP sources detected at an off-axis angle larger than 20 arcmin to the center of the pointing. |
| In the text | |
|
Fig. 9. X-ray activity as a function of the Rossby number for Hyades members with known rotation period. The dots indicate sources detected in X-rays, while the triangles show upper limits. In contrast to the sources in the core, the Hyades members in the tails are outlined in black. The color scales with the BP − RP color. The red dashed line indicates the best fit. |
| In the text | |
Current usage metrics show cumulative count of Article Views (full-text article views including HTML views, PDF and ePub downloads, according to the available data) and Abstracts Views on Vision4Press platform.
Data correspond to usage on the plateform after 2015. The current usage metrics is available 48-96 hours after online publication and is updated daily on week days.
Initial download of the metrics may take a while.