Fig. 5.
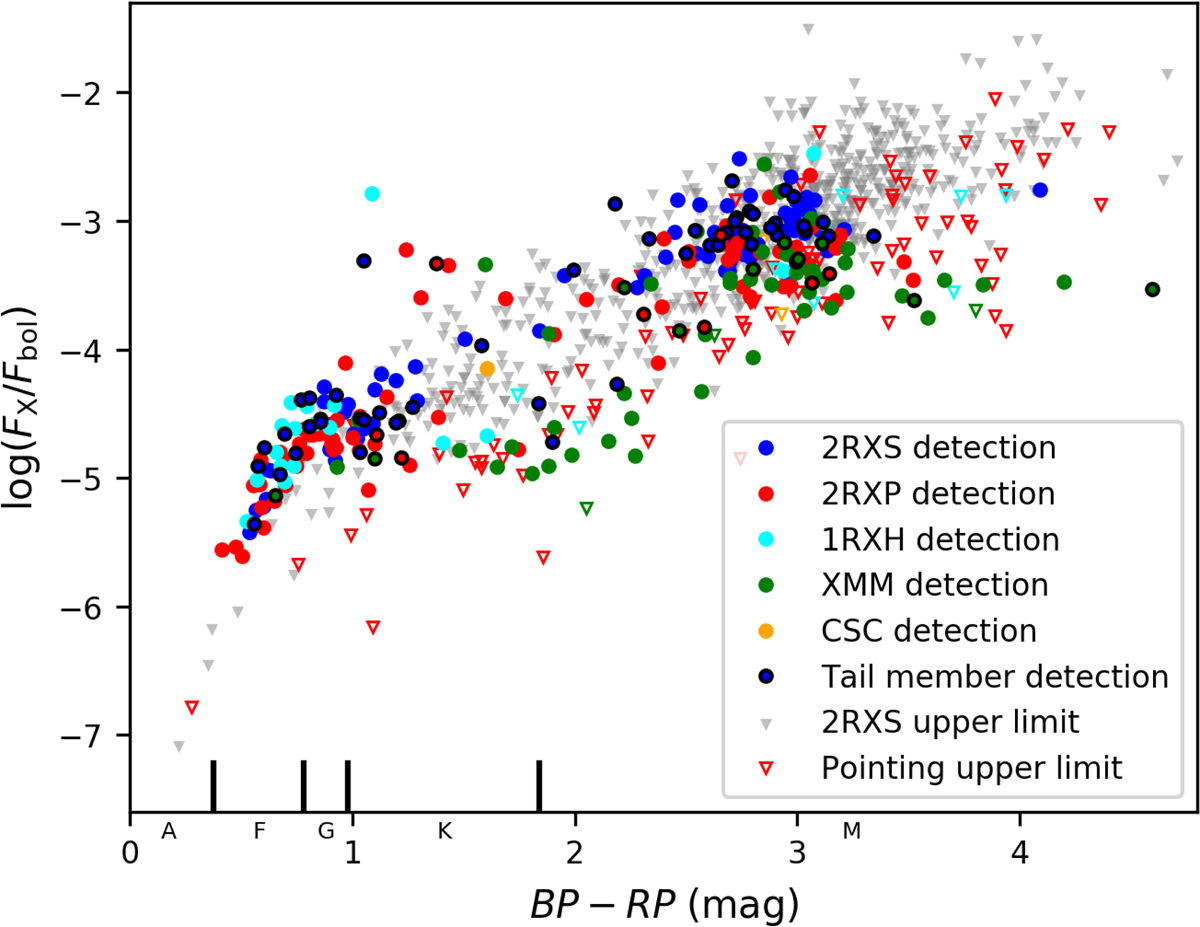
X-ray to bolometric flux distribution of the Hyades as a function of the BP − RP color. Blue, red, cyan, green, and orange dots indicate the values adopted from 2RXS, 2RXP, 1RXH, XMM, and CSC, respectively, while the triangles show the upper limits from 2RXP, 1RXH, and XMM pointings. The upper limits from 2RXS are shown as gray triangles in the background. In contrast to the detections in the core, the Hyades members in the tails are outlined in black. At the bottom we show the ranges of the spectral types as a guidance.
Current usage metrics show cumulative count of Article Views (full-text article views including HTML views, PDF and ePub downloads, according to the available data) and Abstracts Views on Vision4Press platform.
Data correspond to usage on the plateform after 2015. The current usage metrics is available 48-96 hours after online publication and is updated daily on week days.
Initial download of the metrics may take a while.