Fig. 6.
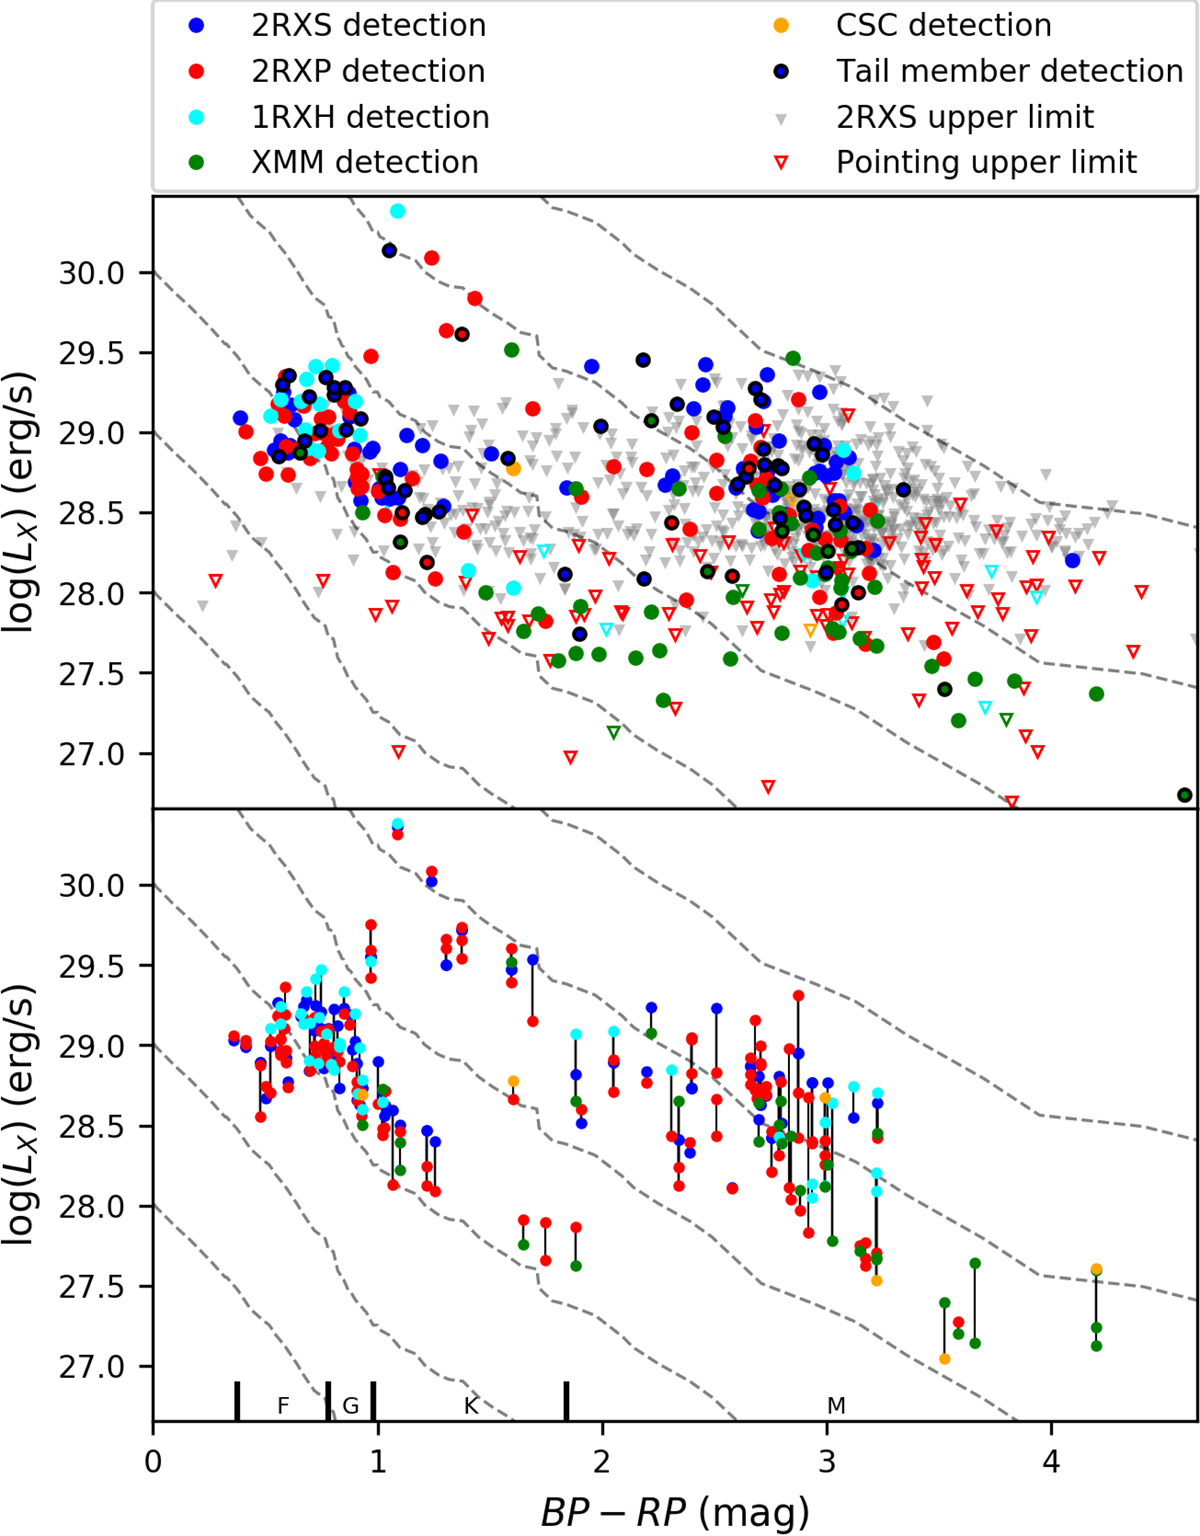
X-ray luminosities of the Hyades as a function of the BP − RP color. The color coding is the same as in Fig. 5. From top to bottom, the dashed lines indicate activity levels of LX/Lbol = −2, −3, −4, −5, −6, and −7 for sources located on the main sequence. The upper panel shows the best X-ray luminosity for the individual Hyades members, while the bottom panel compares the X-ray luminosities measured by different instruments or pointings for multiple detected sources. Detections of the same source are connected by a string.
Current usage metrics show cumulative count of Article Views (full-text article views including HTML views, PDF and ePub downloads, according to the available data) and Abstracts Views on Vision4Press platform.
Data correspond to usage on the plateform after 2015. The current usage metrics is available 48-96 hours after online publication and is updated daily on week days.
Initial download of the metrics may take a while.