Fig. 1.
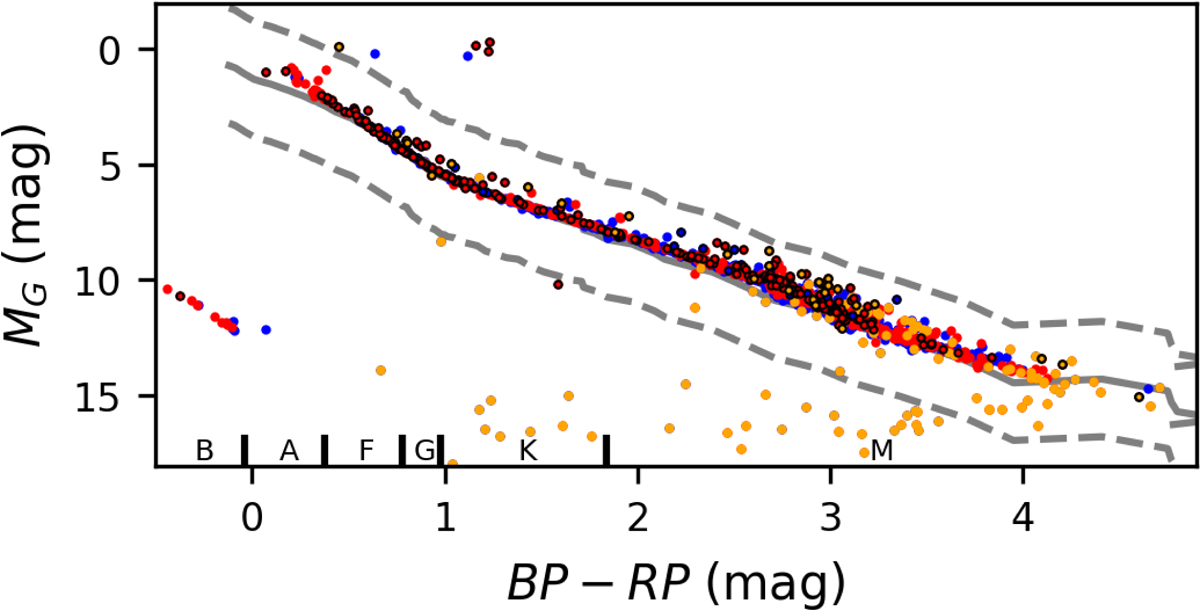
Hertzsprung-Russell diagram of the Hyades. The red and blue sources indicate Hyades members in the core and in the tails, respectively. The orange sources are only associated to the Hyades by Lodieu et al. (2019), sources outlined in black are detected X-rays. The theoretical main sequence adopted from Worthey & Lee (2011) is shown by the black solid line, while the dashed lines indicate the values 2.5 mag brighter and fainter than the main sequence.
Current usage metrics show cumulative count of Article Views (full-text article views including HTML views, PDF and ePub downloads, according to the available data) and Abstracts Views on Vision4Press platform.
Data correspond to usage on the plateform after 2015. The current usage metrics is available 48-96 hours after online publication and is updated daily on week days.
Initial download of the metrics may take a while.