Fig. 9.
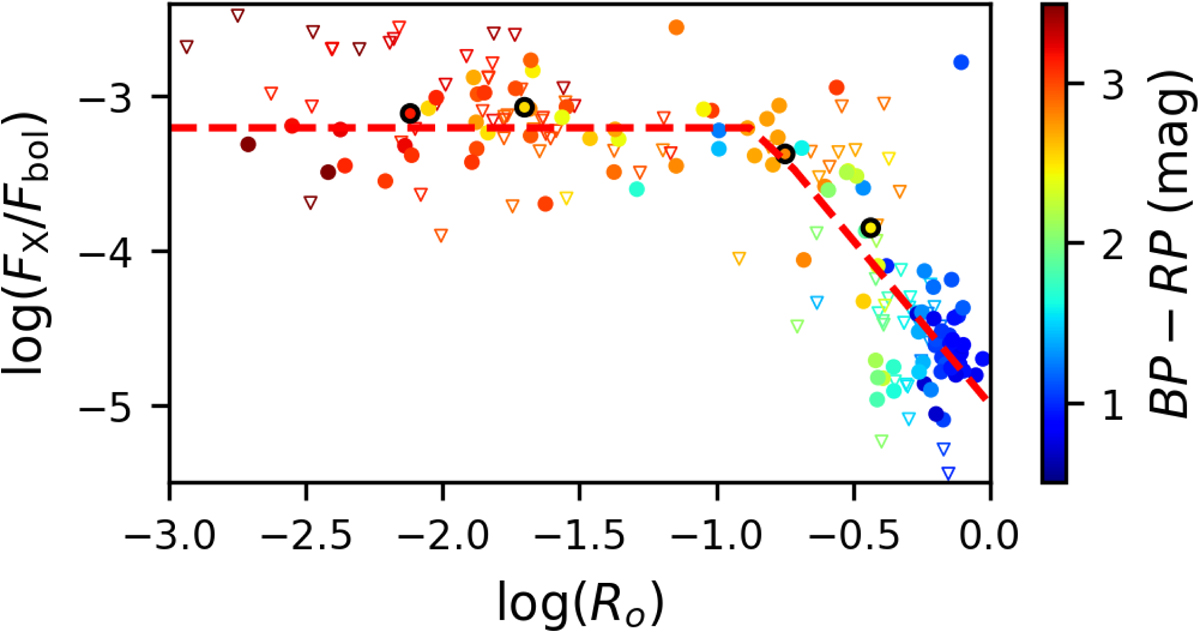
X-ray activity as a function of the Rossby number for Hyades members with known rotation period. The dots indicate sources detected in X-rays, while the triangles show upper limits. In contrast to the sources in the core, the Hyades members in the tails are outlined in black. The color scales with the BP − RP color. The red dashed line indicates the best fit.
Current usage metrics show cumulative count of Article Views (full-text article views including HTML views, PDF and ePub downloads, according to the available data) and Abstracts Views on Vision4Press platform.
Data correspond to usage on the plateform after 2015. The current usage metrics is available 48-96 hours after online publication and is updated daily on week days.
Initial download of the metrics may take a while.