| Issue |
A&A
Volume 666, October 2022
|
|
|---|---|---|
| Article Number | C3 | |
| Number of page(s) | 2 | |
| Section | Interstellar and circumstellar matter | |
| DOI | https://doi.org/10.1051/0004-6361/201629711e | |
| Published online | 18 October 2022 | |
Low temperature MIR to submillimeter mass absorption coefficient of interstellar dust analogues
I. Mg-rich glassy silicates★ (Corrigendum)
1
IRAP, Université de Toulouse, CNRS, UPS, IRAP,
9 avenue colonel Roche,
BP 44346,
31028
Toulouse Cedex 4, France
e-mail: This email address is being protected from spambots. You need JavaScript enabled to view it.
2
Institute of Chemical Engineering Sciences, FORTH,
PO Box 1414,
26504
Patras, Greece
3
Department of Chemical Engineering, University of Patras,
26504
Patras, Greece
4
UMET, UMR 8207,
Université Lille 1, CNRS,
59655
Villeneuve d'Ascq, France
5
Ligne AILES - Synchrotron SOLEIL, L'Orme des Merisiers,
91192
Gif-sur-Yvette, France
6
Université de Toulouse, INSA, CNRS, LPCNO,
31077
Toulouse, France
7
Space Research Institute, RAS,
84/32 Profsoyuznaya,
117810
Moscow, Russia
Key words: dust / extinction / submillimeter: ISM / infrared: ISM / methods: laboratory: solid state / astrochemistry / errata / addenda
Data from this article are publicly available through the STOP-CODA (SpecTroscopy and Optical Properties of Cosmic Dust Analogues) database of the SSHADE infrastructure of solid spectroscopy (https://doi.org/10.26302/SSHADE/STOPCODA). The dataset is accessible via the following link: https://www.sshade.eu/data/experiment/EXPERIMENT_KD_20170711
We would like to draw attention to the fact that the mass absorption coefficients (MACs) presented in the paper “Low temperature MIR to submillimeter mass absorption coefficient of interstellar dust analogues. I. Mg-rich glassy silicates” published in A&A 600, A123 (2017) are the MACs of the grains in the polyethylene matrix and not in vacuum. Indeed, Eq. (4) in Demyk et al. (2017) gives the MAC for the isolated grains in the matrix. The additional step to correct for the effect of the matrix, which is detailed in Mennella et al. (1998), was not done in Demyk et al. (2017). Therefore, in order to compare the experimental MACs presented in Demyk et al. (2017) with those calculated from optical constants available in databases or in cosmic dust models, it is necessary to perform the calculations in the same medium used to acquire the experimental data. This has not been done in Demyk et al. (2017) where Sect. 5.1, Figs. 5 and 8, and Table 1 compare MACs that are not comparable: the MACs for grains in polyethylene (PE) for the measurements and the MACs for grains in vacuum for the cosmic dust models. We provide here new versions of Table 1 and Figs. 5 and 8 of Demyk et al. (2017) in which the MAC for the silicates from astronomical models were calculated in an ambient medium of refractive index n = 1.51 similar to the one of the pellets (polyethylene). Table 1 and Figs. 1 and 2 of the corrigendum replace Table 1, Fig. 5, and Fig. 8 of Demyk et al. (2017), respectively.
The main conclusions of the comparison of the experimental data with cosmic dust models have not changed: the measured MACs of the X40, X50A, and X50B samples are higher than the MACs of cosmic dust models and their spectral shapes are very different from the λ−2 asymptotic behaviour adopted in cosmic dust models. However, the amplitude of the differences are reduced (see Table 1 and Fig. 1). The X40 sample, the most absorbent, is 2−2.4 times more absorbent at 100 µm than the models and about 5 to 9 times at longer wavelengths. The two X50 samples are 1.3−2.7 times more absorbent than the models over the entire spectral range. For the X35 samples the MAC is 1.5−2.3 times more absorbent in the 100−300 µm range and becomes as absorbent or even less absorbent at longer wavelengths. At λ = 100 µm, the MAC averaged over the four samples with different compositions, 〈MAC1〉, is twice as large as the MAC from the dust model calculated for a collection of spherical grains with a size distribution centred at 1 µm and 2.4 times larger at λ = 1mm for 10 K grains (Table 1 and Fig. 2). At 10 K, 〉MAC1〉 is 1.7 and 2 times larger than the MAC calculated for a continuous distribution of ellipsoid (CDE) at 100 µm and 1 mm, respectively. At 10 K, 〉MAC2〉, the MAC averaged over the three samples with different compositions, X35, X50A, and X50B, is higher than the modelled MACs by a factor of ~1.7 at 100 and 250 µm, 1.3 at 500 µm, and by a factor of ~1 at 1 mm. The decrease in the MAC value with the temperature has to be considered in models based on MIR-to-FIR experimental MACs since using MACs measured at room-temperature instead of 10 K induces errors of a factor of 1.3−7 on the MAC (see Table 1) and thus on the calculated dust mass, depending on the sample and wavelength.
This also affects the comparison with previous experimental data if they are corrected for the effect of the matrix. Mennella et al. (1998) indicated that the matrix-correction factor is of the order of 1.3 for amorphous fayalite. Therefore, the MAC presented in Demyk et al. (2017) should be divided by a similar factor to be compared with experimental data from Mennella et al. (1998), Boudet et al. (2005), and Agladze et al. (1996). However, for a more reliable comparison, we advise the use of the optical constants derived from these MACs by Demyk et al. (2022) to simulate the MAC of the grains in a vacuum.
References
- Agladze, N. I., Sievers, A. J., Jones, S. A., Burlitch, J. M., & Beckwith, S. V. W. 1996, ApJ, 462, 1026 [NASA ADS] [CrossRef] [Google Scholar]
- Boudet, N., Mutschke, H., Nayral, C., et al. 2005, ApJ, 633, 272 [Google Scholar]
- Demyk, K., Meny, C., Leroux, H., et al. 2017, A&A, 606, A50 [NASA ADS] [CrossRef] [EDP Sciences] [Google Scholar]
- Demyk, K., Gromov, V., Meny, C., et al. 2022, A&A, in press https://doi.org/10.1051/0004-6361/202243815 [Google Scholar]
- Jones, A. P., Fanciullo, L., Köhler, M., et al. 2013, A&A, 558, A62 [NASA ADS] [CrossRef] [EDP Sciences] [Google Scholar]
- Li, A., & Draine, B. T. 2001, ApJ, 554, 778 [Google Scholar]
- Mennella, V., Brucato, J. R., Colangeli, L., et al. 1998, ApJ, 496, 1058 [NASA ADS] [CrossRef] [Google Scholar]
© K. Demyk et al. 2022
 Open Access article, published by EDP Sciences, under the terms of the Creative Commons Attribution License (https://creativecommons.org/licenses/by/4.0), which permits unrestricted use, distribution, and reproduction in any medium, provided the original work is properly cited.
This article is published in open access under the Subscribe-to-Open model. This email address is being protected from spambots. You need JavaScript enabled to view it. to support open access publication.
All Tables
Value of the MAC in the polyethylene matrix for the glassy samples X35, X4O, X5OA, and X5OB compared with that for the silicate component of cosmic dust models in polyethylene.
All Figures
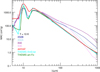 |
Fig. 1 Comparison of the measured MAC of the samples X5OA, X5OB, X4O, and X35 at 10 K with the M ACs calculated for cosmic dust models using Mie theory for spherical grains of 0.1 μm in size: astrosìl from (Li & Draine 2001) (red curve) and the two silicates from the THEMIS dust model (Jones et al. 2013): amorphous enstatite (cyan curve) and amorphous forsterite (green curve). We note that to be comparable with the experimental data, the MACs were modelled in PE and not in vacuum. |
| In the text | |
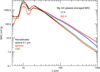 |
Fig. 2 Comparison of averaged experimental MAC with the MACs calculated from cosmic dust model. The solid line curves with the uncertainty represent the MAC averaged on the four samples X35, X4O, X5OA, and X5OB: (red) MAC at 300 K, (blue) MAC at 10 K. The MAC for the astrosìl from (Li & Draine 2001) was calculated using Mie theory for a 0.1 μm size grain (black), for a log-normal grain size distribution with a mean diameter of 1 μm for spherical grains (red), and for a CDE model (green). We note that to be comparable with the experimental data, the MACs were not modelled in vacuum but in PE. |
| In the text | |
Current usage metrics show cumulative count of Article Views (full-text article views including HTML views, PDF and ePub downloads, according to the available data) and Abstracts Views on Vision4Press platform.
Data correspond to usage on the plateform after 2015. The current usage metrics is available 48-96 hours after online publication and is updated daily on week days.
Initial download of the metrics may take a while.