Fig. 2
Download original image
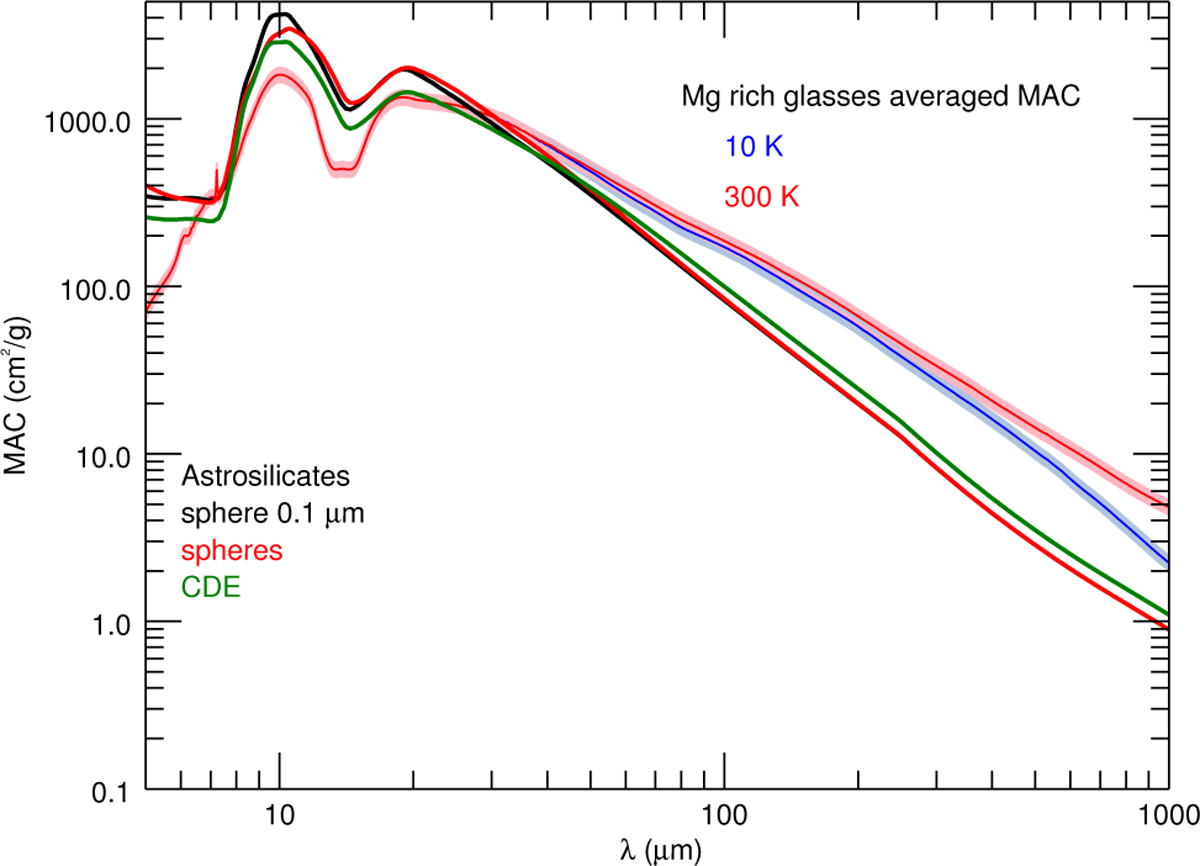
Comparison of averaged experimental MAC with the MACs calculated from cosmic dust model. The solid line curves with the uncertainty represent the MAC averaged on the four samples X35, X4O, X5OA, and X5OB: (red) MAC at 300 K, (blue) MAC at 10 K. The MAC for the astrosìl from (Li & Draine 2001) was calculated using Mie theory for a 0.1 μm size grain (black), for a log-normal grain size distribution with a mean diameter of 1 μm for spherical grains (red), and for a CDE model (green). We note that to be comparable with the experimental data, the MACs were not modelled in vacuum but in PE.
Current usage metrics show cumulative count of Article Views (full-text article views including HTML views, PDF and ePub downloads, according to the available data) and Abstracts Views on Vision4Press platform.
Data correspond to usage on the plateform after 2015. The current usage metrics is available 48-96 hours after online publication and is updated daily on week days.
Initial download of the metrics may take a while.