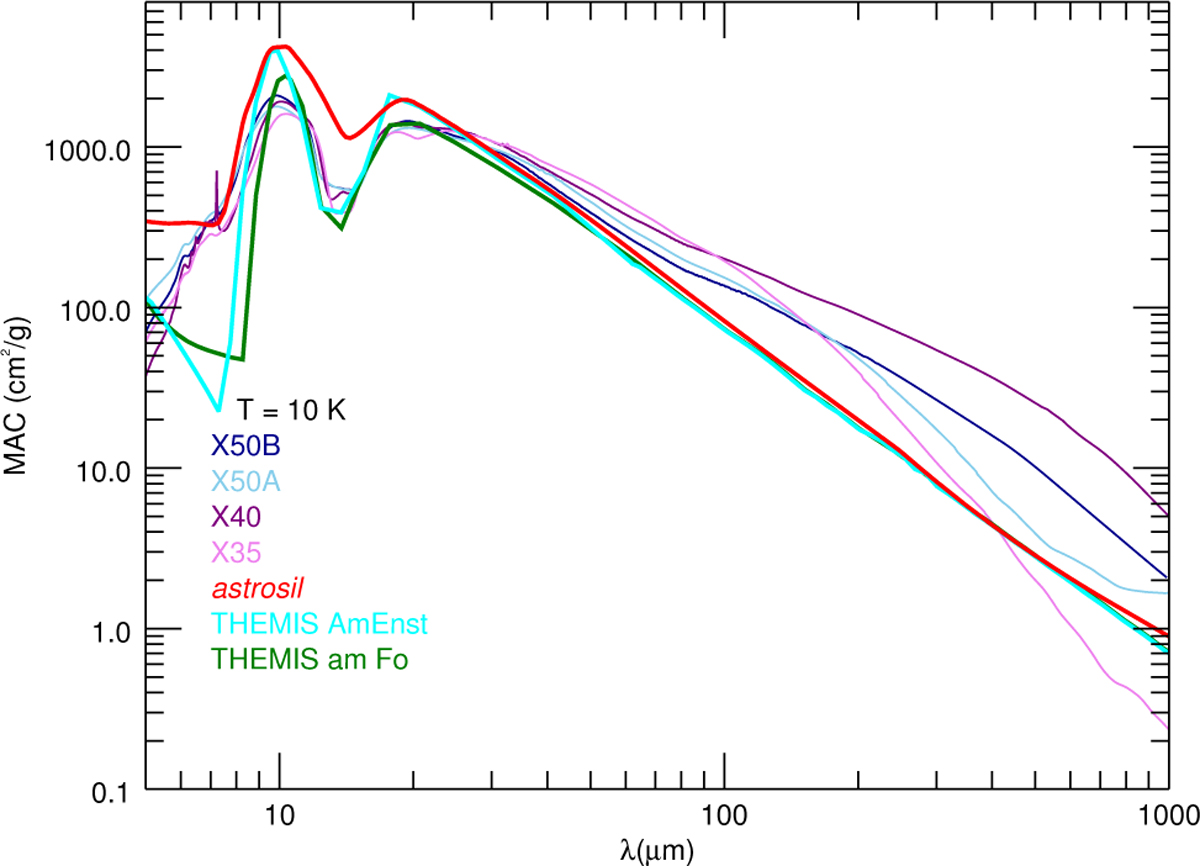
Fig. 1
Download original image
Comparison of the measured MAC of the samples X5OA, X5OB, X4O, and X35 at 10 K with the M ACs calculated for cosmic dust models using Mie theory for spherical grains of 0.1 μm in size: astrosìl from (Li & Draine 2001) (red curve) and the two silicates from the THEMIS dust model (Jones et al. 2013): amorphous enstatite (cyan curve) and amorphous forsterite (green curve). We note that to be comparable with the experimental data, the MACs were modelled in PE and not in vacuum.
Current usage metrics show cumulative count of Article Views (full-text article views including HTML views, PDF and ePub downloads, according to the available data) and Abstracts Views on Vision4Press platform.
Data correspond to usage on the plateform after 2015. The current usage metrics is available 48-96 hours after online publication and is updated daily on week days.
Initial download of the metrics may take a while.