| Issue |
A&A
Volume 565, May 2014
|
|
|---|---|---|
| Article Number | A40 | |
| Number of page(s) | 14 | |
| Section | Stellar structure and evolution | |
| DOI | https://doi.org/10.1051/0004-6361/201323189 | |
| Published online | 01 May 2014 | |
The rapid evolution of the exciting star of the Stingray nebula⋆,⋆⋆,⋆⋆⋆
1 Institute for Astronomy and Astrophysics, Kepler Center for Astro and Particle Physics, Eberhard Karls University, Sand 1, 72076 Tübingen, Germany,
e-mail: This email address is being protected from spambots. You need JavaScript enabled to view it.
2 Inter-University Centre for Astronomy and Astrophysics, Post Bag 4, Ganeshkhind, 411007 Pune, India
3 NASA Goddard Space Flight Center, Greenbelt MD 20771, USA
4 Institute for Physics and Astronomy, University of Potsdam, Karl-Liebknecht-Str. 24/25, 14476 Potsdam, Germany
Received: 4 December 2013
Accepted: 12 March 2014
Abstract
Context. SAO 244567, the exciting star of the Stingray nebula, is rapidly evolving. Previous analyses suggested that it has heated up from an effective temperature of about 21 kK in 1971 to over 50 kK in the 1990s. Canonical post-asymptotic giant branch evolution suggests a relatively high mass while previous analyses indicate a low-mass star.
Aims. A comprehensive model-atmosphere analysis of UV and optical spectra taken during 1988–2006 should reveal the detailed temporal evolution of its atmospheric parameters and provide explanations for the unusually fast evolution.
Methods. Fitting line profiles from static and expanding non-LTE model atmospheres to the observed spectra allowed us to study the temporal change of effective temperature, surface gravity, mass-loss rate, and terminal wind velocity. In addition, we determined the chemical composition of the atmosphere.
Results. We find that the central star has steadily increased its effective temperature from 38 kK in 1988 to a peak value of 60 kK in 2002. During the same time, the star was contracting, as concluded from an increase in surface gravity from log g = 4.8 to 6.0 and a drop in luminosity. Simultaneously, the mass-loss rate declined from log (Ṁ/M⊙ yr-1) = −9.0 to −11.6 and the terminal wind velocity increased from v∞ = 1800 km s-1 to 2800 km s-1. Since around 2002, the star stopped heating and has cooled down again to 55 kK by 2006. It has a largely solar surface composition with the exception of slightly subsolar carbon, phosphorus, and sulfur. The results are discussed by considering different evolutionary scenarios.
Conclusions. The position of SAO 244567 in the log Teff–log g plane places the star in the region of sdO stars. By comparison with stellar-evolution calculations, we confirm that SAO 244567 must be a low-mass star (M< 0.55 M⊙). However, the slow evolution of the respective stellar evolutionary models is in strong contrast to the observed fast evolution and the young planetary nebula with a kinematical age of only about 1000 years. We speculate that the star could be a late He-shell flash object. Alternatively, it could be the outcome of close-binary evolution. Then SAO 244567 would be a low-mass (0.354 M⊙) helium pre-white dwarf after the common-envelope phase, during which the planetary nebula was ejected.
Key words: stars: abundances / stars: evolution / stars: AGB and post-AGB / stars: individual: SAO 244567 / stars: fundamental parameters / planetary nebulae: individual: Stingray nebula (Henize 3-1357)
Based on observations with the NASA/ESA Hubble Space Telescope, obtained at the Space Telescope Science Institute, which is operated by the Association of Universities for Research in Astronomy, Inc., under NASA contract NAS5-26666.
Based on observations made with the NASA-CNES-CSA Far Ultraviolet Spectroscopic Explorer.
Tables 1 and 3, and Figs. 4–9 are available in electronic form at http://www.aanda.org
© ESO, 2014
1. Introduction
The long stellar evolutionary time scales mean it is in general impossible for an astronomer to “watch” a star evolving in real time. Intermediate-mass stars (MZAMS = 0.8−8 M⊙) experience their most rapid evolution close to the end of their nuclear-burning phase. Observing stars during this period provides the unique opportunity to investigate on the stellar asymptotic giant branch (AGB) and post-AGB evolution, including the AGB mass-loss phase, and the ejection, shaping, and excitation of planetary nebulae (PNe) – phases that are still not fully understood.
SAO 244567, the exciting star of the Stingray nebula (Henize 3-1357, Henize 1976), is an unusually fast evolving star. It was first classified to be a hot post-AGB star (Parthasarathy & Pottasch 1989) based on the discovery of a circumstellar dust shell with far-IR (IRAS) colors and flux distribution similar to that of PNe. Based on a spectral classification of the optical spectrum obtained in 1971, Parthasarathy et al. (1995) concluded that the star was a B1 or B2 supergiant. From the UBV colors and the 1971 spectrum, they estimated Teff = 21 kK. However, they found that the optical spectra from 1990 and 1992 as well as the IUE1 spectra (1992−1996) display many nebular emission lines, indicating that SAO 244567 has turned into a central star of a PN (CSPN) within a time span of only 20 years. Furthermore, when comparing the IUE spectra from 1988 and 1995 Parthasarathy et al. (1995) discovered it is the only known CSPN that faded by a factor of 2.83 in its flux level within seven years. In addition, it was possible for them to observe how the stellar wind gradually decreased. From the IUE spectrum obtained in 1988, Parthasarathy et al. (1995) measured a terminal wind velocity of v∞ = 3500 km s-1 from the C iv resonance doublet. The IUE spectrum in 1994 showed that the stellar wind vanished. Based on the IUE spectra, they estimated that Teff must be around 55 kK. Assuming a distance of 5.6 kpc (Kozok 1985b) and an expansion velocity of 8 km s-1, Parthasarathy et al. (1993) found that the post-AGB time of SAO 244567 is about 2700 years. Furthermore, they estimated the luminosity and core mass of the CS to be 3000 L⊙ and 0.55 M⊙, respectively.
The first optically resolved images of the Stingray nebula were presented by Bobrowsky (1994) and Bobrowsky et al. (1998) using the Wide Field and Planetary Camera 1 (WFPC1) and WFPC2, respectively. Bobrowsky (1994) found that in H β, the Stingray nebula appears to have an equatorial ring of enhanced density tilted approximately 56° from the line of sight. In addition, he found bubbles of gas above and below the ring with areas of decreased brightness near the poles where a fast stellar wind has broken through the red giant envelope. From the H β flux, he derived an ionized mass of 0.2 M⊙, L = 5000 L⊙ and a stellar core mass of 0.59 M⊙. Thanks to the superior spatial resolution of the WFPC2 Bobrowsky et al. (1998) found evidence of collimated outflows, which are focused by the nebula bubbles and function like nozzles, with gas leaving through the polar holes. They also report a possible detection of a late type companion star at a distance of 2200 AU from the central star.
Umana et al. (2008) present the first detailed radio study of the Stingray nebula by using the Australian Telescope Compact Array (ATCA). They find that the Stingray nebula is still embedded in the dusty remnant of the AGB phase. Depending on their models, they derived an ionized mass of 0.057–0.07 M⊙ and a total dust mass of 2 × 10⁻⁴ M⊙ in the case of silicates and 7.5 × 10⁻⁵ M⊙ in case of graphite.
Arkhipova et al. (2013) performed an analysis of the nebula spectra taken in 1990, 1992, and 2011. They find significant changes in the relative line intensities. The low-excitation [O i], [O ii], and [N ii] lines became stronger relative to H β by a factor of two, while the [O iii] lines weakened by a factor of ≈2. Using a formula of Kaler (1978), they estimated that Teff decreased from 1990 (Teff = 57 kK) to 2011 (Teff = 40 kK).
Parthasarathy et al. (1995) first discovered that the observed properties of SAO 244567, e.g. the rapid changes in Teff and the drop of luminosity, contradict with canonical post-AGB evolution. For such a rapid evolution, the core mass should be 0.8 M⊙ or even more (Parthasarathy et al. 1995; Bobrowsky et al. 1998). The evolutionary time scales for CSs with core masses of 0.6 M⊙ or less are predicted to be much longer (Blöcker 1995).
To address the evolution of the properties of SAO 244567 quantitatively for the first time, we carried out a spectral analysis based on all available spectra from 1988 until 2006 taken with IUE, FUSE2, HST/STIS3, and HST/FOS4. The comparison of the results to different evolutionary models should help provide conclusions on the nature of SAO 244567.
This paper is organized as follows. In Sect. 2, we describe the observations. The spectral analysis follows in Sect. 3. In Sect. 4, we summarize our results and derive the distance and the mass of SAO 244567. We discuss possible stellar evolutionary scenarios and compare SAO 244567 to other low-mass CSPNe. We conclude in Sect. 5.
2. Observations
SAO 244567 was observed with various telescopes (Table 1). Parthasarathy et al. (1995) reported the decrease in the flux level of the IUE observations by a factor of 2.83. We found that SAO 244567 has faded even more; e.g., we found a decrease by a factor of five by comparing the IUE observation from 1988 to the FOS observation in 1997. In Fig. 1, we show all available, reliable flux-calibrated observations of SAO 244567. The STIS observations are not photometric because of the narrow slit width used and therefore are not shown in Fig. 1. Comparing the FOS observation in 1997 to the FUSE observations in 2002, we found that the flux must have increased slightly. Comparing the flux level of the FUSE spectrum from 2002 to the one in 2006, we found a decrease of 15%. We mention all the available spectra and their special features in Sect. 2.1. The determination of the interstellar reddening follows in Sect. 2.2.
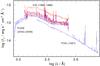 |
Fig. 1 All reliably flux-calibrated observations of SAO 244567. |
2.1. Description of the spectra
IUE spectra were taken from 1988 to 1996. All these observations but SWP51772 and SWP55690 were obtained in low-resolution mode. The main features in the spectra are nebular emission lines (from 1992 on) and the C iv and N v resonance doublets that are blue shifted and show P-Cygni profiles (Sect. 3.4).
The HST/FOS spectra were obtained in 1997 using the G190H, G270H, G400H, and G570H gratings (total exposure time ≈4600 s, ProgID 6039). The observations cover a wavelength range from ≈1600 to 6800 Å.
SAO 244567 was observed with HST/STIS in 1998 (ProgID 7652), 1999 (ProgID 7652, 7653), and 2001 (ProgID 8929) using the 52′′× 0 05 aperture. These observations cover a total wavelength range from 1540 to 6000 Å and from 9050 to 9650 Å. In the optical wavelength range (3200 to 6800 Å), the HST/FOS and HST/STIS spectra show many nebular emission lines, but also some photospheric He ii lines (partially blended by the nebula emission lines). The NUV spectra turned out to be more useful for the spectral analysis, because of the He ii lines (n → n′ = 3 → 6,...,14), which could be used to determine log g, Teff, and the H/He ratio. We identified C iii and C iv lines which allowed us a more precise determination of Teff by evaluation of the C iii/C iv ionization equilibrium (see Sect. 3.2). Apart from the photospheric lines, we found some interstellar Fe ii, Mg ii, and Mn ii lines.
FUV spectra were taken with FUSE in 2002 and 2006 (total exposure time: 31 ksec, ProgIDs Q304 and U109) using the LWRS aperture. These spectra show many interstellar lines, but also photospheric H i, He ii, C iii, C iv, N iii (2002 only), N iv, O iii, O iv, Si iv, P v, S iv, S v, S vi, Fe v, and Fe vi lines. Furthermore, the O vi doublet lines show weak P-Cygni profiles. We checked the FUSE observations for relative motion of interstellar and photospheric lines, but we could not find any hint of velocity shifts either by comparing the observation from 2002 and 2006, or in the individual exposures of the corresponding years. This indicates (except in case of a very high inclination angle) the probability of a close companion is rather unlikely. All these space-based observations were retrieved from the MAST archive.
2.2. Interstellar reddening
We derived the interstellar reddening for each observation. The flux shape of the IUE, STIS, and FOS spectra can only be reproduced using the LMC reddening law of (Howarth 1983). The FUSE observations could be fitted with the reddening law of Fitzpatrick (1999). Figure 2 shows the determination of EB − V for the FOS observation. Since the impact of the interstellar reddening is negligible in the infrared, the TMAW model flux of our best fit model to the FOS observation (Teff = 50 kK, log g = 5.5, Sect. 3.2) was firstly normalized to the reddest part of the spectrum. Then, we corrected the model flux for different values of EB − V to fit the model flux to the observation.
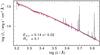 |
Fig. 2 Example for the determination of EB − V for SAO 244567. The FOS observation (gray) is compared to TMAW model fluxes with different corrections for the interstellar reddening. The thick (red in online version) line represents the TMAW model corrected with EB − V = 0.14, the dashed lines (blue) indicate the error limits. |
We confirm the variations in EB − V found by Arkhipova et al. (2013), who measured the reddening from the H β line intensity, using the simple relation, EB − V = 0.68×c(H β), with the extinction coefficient c(H β). In Table 2, we compare our values with those of other authors.
Interstellar reddening of SAO 244567.
3. Spectral analysis
The procedure of our spectral analysis is the following. First, we derived Teff, log g, and the abundances (or at least upper limits) of the elements H, He, C, N, O, Ne, Si, P, S, Fe, and Ni with the Tübingen NLTE model-atmosphere package (TMAP5, Werner et al. 2003; Rauch & Deetjen 2003) from the FOS, STIS, and FUSE spectra. The mass-loss rate of SAO 244567 during those years, in which these observations were taken, is negligible and therefore it is justified to use a code for hydrostatic atmospheres. We compared the PoWR6 (Potsdam Wolf-Rayet model-atmosphere code, Gräfener et al. 2002; Hamann & Gräfener 2003, 2004) and TMAP models for the FUSE observations and found that apart from the O vi P Cygni profiles, the spectral lines are reproduced equally well. The TMAP analysis is described in Sect. 3.1. To study the mass-loss rates and terminal wind velocities from the P Cygni profiles found in the IUE and FUSE spectra and to determine Teff in the years of the IUE observations, we used PoWR. The description of this analysis can be found in Sect. 3.4.
3.1. TMAP model atmospheres
We used TMAP to compute non-LTE, plane-parallel, fully metal-line blanketed model atmospheres in radiative and hydrostatic equilibrium. The final models included opacities of the elements H, He, C, N, O, Ne, Si, P, S, Fe, and Ni. The model atoms for this analysis were taken from the Tübingen model-atom database TMAD7 and calculated (Fe, Ni) via the Tübingen iron-group opacity interface TIRO8 (Müller-Ringat 2013). It has been developed recently in the framework of the Virtual Observatory (VO9) and is provided as a registered service by the German Astrophysical Virtual Observatory (GAVO10). The statistics of the model atoms used in this analysis are summarized in Table 3. All spectral energy distributions that were calculated for this analysis are available via the registered GAVO service TheoSSA11.
In a standard procedure (e.g. Ziegler et al. 2012), we modeled both, the photospheric and the interstellar line-absorption spectrum, to correctly identify the stellar lines. We employed the OWENS program to model the ISM line absorption with several ISM clouds with different parameters (radial and turbulent velocities, temperatures, and column densities of the individual ions). In the following, we describe our photospheric analysis.
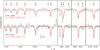 |
Fig. 3 Comparison of our best-fit TMAP models (black, red in online version) to the FOS and STIS observation (gray). He ii, C iii–iv, and interstellar Fe ii lines are marked. The vertical bar indicates 10% of the continuum flux. |
3.2. Effective temperature, surface gravity, H/He ratio, C abundance
Based on the IUE spectrum in 1995, Parthasarathy et al. (1995) estimated Teff ≈ 55 kK. Starting with this value, we computed a grid of H+He composed model atmospheres (Teff = 40−70 kK, 10 kK steps), log g = 4.0−7.0, 0.5 steps), H/He abundance ratios (by mass) of 9/1, 3/1 (i.e. solar), and 2/3 for a preliminary Teff and log g determination. The synthetic spectra of these models were then compared to the observed He line profiles in the STIS and FOS spectra.
He II λ 2723.2 Å is much too strong in all H/He = 2/3 models so we can rule out He enrichment. The H/He = 9/1 models show that SAO 244567 is not He-poor because it is not possible to match the strengths and wings of the He ii lines. All line profiles are reproduced well with a solar H/He ratio at log g = 6.0 and Teff = 50,60,70 kK for the STIS spectrum. For the FOS observations the best fit was found for log g = 5.5 and Teff = 40,50,60 kK. We adopted this abundance ratio for our analysis.
We identified several C iii and C iv lines in the FUSE, STIS and FOS spectra. Consequently, we included C in our models to evaluate the C iii/C iv ionization equilibrium and to determine the C abundance. For the determination of the C abundance, we used C III λλ 1165.6−1165.9,1174.9−1176.4 Å and C IV λλ 1107.6−1108.0,1168.8 − 1169.0 Å in the FUSE spectrum and C III λ 2297.6 Å and C iv λλ2336.7−2337.1, 2405.1−2405.9, 2524.41−2530.7 Å in the STIS and FOS spectra. The C IV λλ 1548.2,1550.8 Å resonance doublet is contaminated by the respective interstellar lines, hence not suited to determine the C abundance. The best agreement with the observation was found at C = 5.0 × 10⁻⁴, which is 0.2× solar (solar values according to Asplund et al. 2009) in all spectra. Simultaneously, we refined our model grid (Teff step 5 kK). In Fig. 3, we show the best-fit models for the FOS observation in 1997 and the STIS observation in 1999. We discovered that the ionization equilibrium and also the surface gravity have changed with time. While we determined Teff = 50 kK and log g = 5.5 for the FOS observation, the STIS observation is best reproduced by Teff = 55 kK and log g = 6.0.
In the FUSE spectra, we evaluated ionization equilibria of C iii/C iv, N iii/N iv (FUSE 2002 only), O iii/O iv, and S iv/S v/S vi to derive Teff. In Fig. 4, we show the different ionization equilibria of the FUSE observation in 2002. The model with Teff = 60 kK matches the observations. In the 55 kK model, the O iii and S iv lines are too strong, whereas the S vi line is too weak. In the 65 kK model, the N iii, O iii, S iv, and C iii lines are too weak and the S vi line is too strong. Comparing the FUSE observations from 2002 and 2006, we found that the O iii and S iv lines became slightly stronger. Figure 5 shows that the best agreement in 2006 is obtained for Teff = 55 kK. The value of log g = 6.0 ± 0.5 was confirmed using the He ii line wings. In Table 4, we list the values of Teff and log g that we found from this analysis.
Temporal evolution of the atmospheric parameters as derived from our spectral analysis.
3.3. Element abundances
For determining the abundances of N, O, Si, P, S, and Ni, we used the respective lines found in the FUSE spectra. To derive upper limits, we compared our models to FOS spectra. For the determination of the element abundances, we adopted the values of Teff and log g found for each epoch (Sect. 3.2). The He and C abundances were already achieved as a byproduct of the Teff and log g determination (see above). To calculate the SAO 244567 model grids in a reasonable time, we only included H, He, C, N, and O and added the trace elements Ne, Mg, Si, P, S, Fe, and Ni in a subsequent line-formation calculation; i.e., we kept the atmospheric structure fixed and calculated NLTE occupation numbers only for newly introduced species. This is justified by the comparison of temperature structures of a HHeCNO and a complete, final HHeCNONeSiPSFeNi model, with Teff = 60 kK and log g = 6.0, where the atmospheric structure is calculated with all these elements. Figure 6 demonstrates that the temperature structures are almost identical in the line-formation region (−4 ≲ log m ≲ 1). All abundances found from line-formation calculations are verified with our final models.
Nitrogen and oxygen.
The N abundance of SAO 244567 is solar (N = 6.9 × 10⁻⁴). It was measured using N III λλ 1183.0−1184.6 Å, N IV λλ 1123.5−1133.1 Å, and N IV λ 1183.0 Å lines in the FUSE spectrum. The O abundance was derived from the O III λλ 1149.6−1153.8 Å, and O iv λλ1045.4−1050.5, 1167.8 − 1168.0 Å lines identified in the FUSE spectrum (Fig. 4). We found a solar value (O = 5.6 × 10⁻³).
Neon, sodium, magnesium, silicon, phosphor, and sulfur.
The only Ne line that was prominent in our models is Ne III λ 2678.7 Å. It would emerge from the STIS and FOS spectra above an upper abundance limit of five times the solar value (Ne ≲ 6.2 × 10⁻³). Using Na III λλ 2012.5,2031.8 Å, we derive an upper limit for sodium of ten times the solar value (Na ≲ 2.9 × 10⁻⁴). For magnesium, we derive an upper limit (solar, Mg ≲ 7.1 × 10⁻⁴) using Mg III λλ 2134.7,2178.4 Å. For the determining the Si abundance we used the Si III λ 1113.2 Å and Si IV λ 1128.3 Å lines. All other Si lines are contaminated by interstellar absorption lines. As illustrated in Fig. 7, the best fit is obtained at a solar Si abundance (Si = 6.7 × 10⁻⁴). For lower/higher Si abundances the modeled Si lines are too weak/strong. P V λλ 1118.0,1128.0 Å were used to determine the P abundance (Fig. 8) which is 0.1 × solar (P = 5.8 × 10⁻⁷). We identified S IV λλ 1073.0,1073.5 Å, S V λ 1039.9 Å, and S VI λ 1117.8 Å and determined the S abundance to be 0.5× solar (S = 1.6 × 10⁻⁴).
Iron and nickel.
Some Fe lines could be identified in the FUSE spectra (Fe V λλ 999.6−1001.1 Å, Fe VI λλ 1165.7,1167.7 Å). The Fe abundance was found to be solar (Fe ≲ 1.3 × 10⁻³). The Fe V/Fe VI ionization equilibrium also confirms Teff = 60 kK (Fig. 9). The quality of the available FUSE spectra is not sufficient to unambiguously identify individual Ni lines. Therefore, we could only derive a (solar) upper limit for the Ni (Ni ≲ 7.1 × 10⁻⁵) abundance (Fig. 9). We summarize the abundances in Table 5. Their error limits are ± 0.3 dex.
Photospheric abundances of SAO 244567.
3.4. Stellar wind
Parthasarathy et al. (1993) found that in the IUE spectra of 1988 and 1992 the C iv and N v resonance doublets are blue-shifted and they show P-Cygni profiles. Looking more carefully, we found that all the spectra show P-Cygni profiles in these lines. While in 1988 the P-Cygni profile of N v is quite weak and C iv strong, this changes from 1992 on, which indicates that the star’s Teff has increased. Furthermore, we found in the FUSE spectra that the O VI λλ 1031.9,1037.6 Å resonance lines show P-Cygni profiles, too.
To measure the mass-loss rate and Teff of SAO 244567, we used PoWR. It solves the NLTE radiative transfer in a spherically expanding atmosphere simultaneously with the statistical-equilibrium equations and accounts at the same time for energy conservation. Iron-group line blanking is treated by means of the superlevel approach (Gräfener et al. 2002), and a wind clumping in first-order approximation is taken into account (Hamann & Gräfener 2004). We do not calculate hydrodynamically consistent models, but assume a velocity field following a β-law with β = 1. For the PoWR models, we adopted the elemental abundances that we found in our TMAP analysis. We extrapolated the mass and the luminosity of SAO 244567 using the evolutionary tracks from Hall et al. (2013) and found M = 0.36 M⊙ and log (L/L⊙) = 2.5. We also calculated models with M = 0.47 M⊙ and log (L/L⊙) = 2.2 (values extrapolated from the tracks by Driebe et al. 1998 ), but we found that the line profiles change only slightly with M and L. This agrees with Herald & Bianchi (2007) who report that wind features are not very sensitive to the gravity, which is in the case of the PoWR code an equivalent input parameter.
Based on these assumptions, we varied the terminal wind velocity v∞, mass-loss rate Ṁ, and Teff in our models. The relative strengths of N v/C iv turned out to be very sensitive to Teff, so that we can achieve an error of only ΔTeff = ±3 kK. The sensitvity to Teff can be clearly seen by comparing the best-fit models for 1988 and 1992, where the only difference of these models is Teff. In the Teff = 38 kK model for 1988, C iv is relatively stronger than N v, whereas the opposite holds for the Teff = 43 kK model for 1992. The mass-loss rate was derived from the strengths of the P-Cygni profiles. As the P-Cygni profiles broaden as v∞ increases, v∞ can be measured not only from the blue edge of the absorption component of the P-Cygni profiles, but also from the shape of the emission peak.
The best-fit models are shown in Figs. 10 (IUE spectra) and 11 (FUSE). The P-Cygni profile of O VI λ 1037.6 Å in the PoWR models is blended by interstellar H2 and is therefore not visible in the observation. Furthermore, we found that the absorption components of O VI λλ 1031.9,1037.6 Å must have an interstellar origin. Table 4 lists the parameters that we found from this analysis. The resulting surface gravities are also given. We point out that these values refer to the models with M = 0.36 M⊙, the resulting values for the surface gravity from the M = 0.47 M⊙ models were about 0.1–0.2 dex higher.
We find that the mass-loss rate decreased continuously from log (Ṁ/M⊙ yr-1) = −9.0 in 1988 to log (Ṁ/M⊙ yr-1) = −11.6 in 2006. The previously published value (v∞ = 3500 km s-1, Parthasarathy et al. 1995) turned out to be an overestimate. We find that the terminal wind velocity has steadily increased from v∞ = 1800 km s-1 in 1988 to v∞ = 2800 km s-1 in 2006.
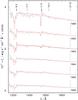 |
Fig. 10 Comparison of the IUE spectra taken from 1988 to 1996 (thin, gray) with the best-fit PoWR model (thick, red). All but the 1988 observation are shifted for clarity. |
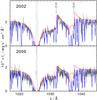 |
Fig. 11 Comparison the FUSE spectra taken in 2002 and 2006 (gray) with the best-fit PoWR model (thick, red). The blue line (thin) indicates the combined stellar and ISM spectrum. |
4. Results and discussion
We analyzed the high-resolution UV spectra taken with FUSE, STIS, FOS, and IUE by means of non-LTE line blanketed model atmospheres. The values of Teff were derived with high precision by evaluating the ionization equilibria of C iii/C iv (FOS, STIS and FUSE spectra), O iii/O iv, S iv/S v/S vi (FUSE spectra), and N iii/N iv (FUSE 2002 spectra). From the IUE spectra, we derived Teff using the relative strength of N v/C iv.
Both the surface gravity and the H/He ratio (solar) were obtained by an analysis of the He II lines found in the STIS and FOS spectra. For the FOS observations, the best fit was found with log g = 5.5, while for the STIS observation the model with log g = 6.0 fits better. This value of log g = 6.0 was confirmed by the wings of the He II lines in the FUSE spectra.
SAO 244567 exhibits solar abundances of H, He, O, and N. The C abundance is definitely subsolar. This indicates that the AGB phase of the star was terminated before the third dredge-up (Mello et al. 2012). P and S were found to be subsolar, the Si and Fe abundances are solar. For Ne, Mg, and Ni, we could only derive upper limits (five times solar for Ne, ten times solar for Na, solar for the rest). We could not find any hint of a change in the chemical abundances during the years. Within the error limits (typically ±0.3 dex) the abundances found for the CS are in good agreement with the nebula abundances (Table 6) determined by Arkhipova et al. (2013) and Parthasarathy et al. (1993).
Comparison of the element abundances (number fractions relatively to H) of SAO 244567 (CS) as derived by our analysis and of its PN as derived by analysis of the spectrum in 1990 (Parthasarathy et al. 1993), 1992, and 2011 (Arkhipova et al. 2013).
The temporal evolution of the atmospheric parameters of SAO 244567 is summarized in Table 4 and Fig. 12. We found that compared to the temperature found from the spectrum in 1971 (Sect. 1) SAO 244567 has increased its Teff by about 40 kK within only thirty years. The peak Teff of 60 kK was reached in 2002, and the 2006 observations suggest that it is now decreasing. We cannot confirm the values for Teff found by Arkhipova et al. (2013). They find the peak Teff in 1990 (Teff = 57 kK), i.e. about 10 kK higher than our analysis from spectra taken at that time. We want to point out, that the formalism of Kaler (1978) used by Arkhipova et al. (2013) might not provide good estimates for the CS temperature. Comparing the Teff of Kaler (1978) found for his sample of CSPNe, shows often big deviations from recent literature values (e.g. NGC 6543: Kaler 1978 found Teff = 45 kK while Herald & Bianchi 2011 found Teff = 60 kK). However, evaluation of the ionization equilibria found in the FUSE spectra shows Teff declining from 2002 on, supporting the contention by Arkhipova et al. (2013) that Teff has recently peaked and has begun to decline.
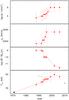 |
Fig. 12 Temporal evolution of Teff, log g, mass-loss rate Ṁ, and the terminal wind velocities v∞ as derived in our analysis (red). The black stars in the bottom panel show the Teff as derived by Arkhipova et al. (2013), the black square indicates the Teff estimate when SAO 244567 was still a B-type supergiant (1971). |
By examining the P-Cygni profiles of the C iv and N v resonance doublets in the IUE spectra from 1988 to 1996 and the P-Cygni profiles of O vi in the FUSE spectra, we derived the mass-loss rates and terminal wind velocities as a function of time. We found a steady decrease in the mass-loss rate (from log (Ṁ/M⊙ yr-1) = − 9.0 in 1988 to log (Ṁ/M⊙ yr-1) = −11.6 in 2006) and the steady increase in the terminal wind velocity (from v∞ = 1800 km s-1 in 1988 to v∞ = 2800 km s-1 in 2006). To compare the mass-loss rate with predictions from radiative-driven wind theory, we used Eq. (5) in Vink & Cassisi (2002) with L = 2.5 L⊙, M = 0.354 M⊙, Teff = 38 kK, and Z = 2 to derive the theoretical value of the mass-loss rate in 1988. We found log Ṁ = −8.8 ± 0.3, which is in good agreement with the observed value. However, we note that the formula given by Vink & Cassisi (2002) might not give the right predictions, since it is meant for a slightly different parameter space in L, Teff, and M.
The decrease in flux with a simultaneous increase of Teff from 1988 to 1999 can be explained by the contraction of the star (L ∝ R2Teff4 ∝ g-1Teff4). This is consistent with the increase in log g as seen in the FOS (1997) and STIS (1999) observations, and consistent with the increase in v∞ which is proportional to vesc ∝ g. The decrease in flux from 2002 to 2006 can be explained by a decrease in Teff as seen in the FUSE spectra.
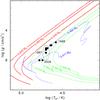 |
Fig. 13 Evolution of SAO 244567 (black dots) in the log Teff–log g plane compared to post-AGB (red, thick) by Blöcker (1995), post-EHB (blue, thin) by Dorman et al. (1993), and post-RGB (green, dashed) evolutionary tracks by Hall et al. (2013) The tracks are labeled with stellar masses. The ellipse indicates the errors of Teff and log g in 1997. |
4.1. Distance
The distance of SAO 244567 was estimated first by Kozok (1985b) using UBV photometry and the assumption of a typical absolute magnitude of a Be star, leading to d = 5.64 kpc. Arkhipova et al. (2013) argues that Kozok (1985b) overestimated the absolute magnitude of SAO 244567 since it was not a main sequence star at that time. Using the estimates of Parthasarathy et al. (1993) for Teff = 37.5 kK and log g = 4.0, they estimated M ≈ 0.55 M⊙ and derived d = 1.8 kpc. We calculated the spectroscopic distance of SAO 244567 using the flux calibration of Heber et al. (1984) for λeff = 5454 Å, ![Mathematical equation: \begin{eqnarray*} d[\mathrm{pc}]=7.11 \times 10^{4} \cdot \sqrt{H_\nu\cdot M \times 10^{0.4\, m_{\mathrm{V}_0}\,-\,\log g}} , \end{eqnarray*}](/articles/aa/full_html/2014/05/aa23189-13/aa23189-13-eq135.png) with mVo = mV − 2.175c, c = 1.47EB − V, and the Eddington flux Hν (7.15 × 10⁻⁴ erg/cm2/s/Hz) at 5454 Å of our model atmosphere (Teff = 50 kK and log g = 5.5). The visual brightness (mV = 14.9) was extracted from the FOS spectrum, so we used all the model parameters found for this year. We assumed EB − V = 0.14 (Sect. 2.2) and a stellar mass of
with mVo = mV − 2.175c, c = 1.47EB − V, and the Eddington flux Hν (7.15 × 10⁻⁴ erg/cm2/s/Hz) at 5454 Å of our model atmosphere (Teff = 50 kK and log g = 5.5). The visual brightness (mV = 14.9) was extracted from the FOS spectrum, so we used all the model parameters found for this year. We assumed EB − V = 0.14 (Sect. 2.2) and a stellar mass of  M⊙ (Sect. 4.2). We derived
  kpc which leads to a height above the Galactic plane of z = 0.3 ± 0.2 kpc. These values are in good agreement with the estimates of Arkhipova et al. (2013). From the angular diameter of 23, a linear radius of the PN of
  pc results. With the expansion velocity of 8.4 km s-1 (Arkhipova et al. 2013), the kinematic age of the PN is only about
  years. We note that different masses, which we derive from various evolutionary scenarios, hardly affect the distance determination and that the large errors are mainly due to the uncertainties in log g.
4.2. Mass and evolutionary status
In Fig. 13, we compare the time-dependent location of SAO 244567 in the log Teff–log g plane with H-rich post-AGB evolutionary tracks by Blöcker (1995), post-EHB-tracks by Dorman et al. (1993), and post-RGB-tracks by Hall et al. (2013). The last represent the evolution of post-common envelope remnants of post-RGB stars that will not ignite He and become low-mass white dwarfs with a He core. The determination of the mass of SAO 244567 would only be possible, if the evolutionary status of this object is known. For that reason, we give only the mass estimates valid for a certain evolutionary scenario below.
The position of SAO 244567 in the log Teff–log g plane places the star in the region of sdO stars. Since SAO 244567 does not match the 0.546 M⊙ track within the error ranges, it may either be a very low-mass post-AGB star with a mass of about 0.53 M⊙ or even an AGB-manqué star, which never reaches the AGB.
The existence of the PN around SAO 244567 suggests that it is more likely a post-AGB star than an AGB-manqué star because – in general – only these stars are expected to eject a PN. If we consider SAO 244567 as a 0.53 M⊙ post-AGB star, it evolves much more quickly than predicted by theory. Comparing Teff = 21 kK estimated for 1971 to the peak value of Teff = 60 kK in 2002, SAO 244567 increased its temperature to 40 kK within only 30 years. According to Fig. 6 in Blöcker (1995) such a rapid evolution (log (dt/ dTeff/ yrK-1) = −3) would be expected only for a 0.87 M⊙ star with an initial mass of about 6 M⊙. For a 0.55 M⊙ star it would take 130 000 years to heat up from Teff = 21 kK to Teff = 60 kK.
An alternative to the canonical post-AGB evolution is a late thermal pulse (LTP, e.g. Blöcker 2001). The evolutionary speed of objects, which are considered to have undergone a (very) late He-shell flash (V605 Aql, e.g., Clayton et al. 2006; V4334 Sgr, e.g., Hajduk et al. 2005; and FG Sge, e.g., Jeffery & Schönberner 2006), is very high (decades). A very late thermal pulse can be ruled out because this scenario produces a hydrogen-free stellar surface, whereas a normal surface composition is typical of a LTP in the phase relevant to SAO 244567. The LTP occurs when the star evolves with roughly constant luminosity from the AGB towards the white dwarf domain. The convective shell triggered by excessive helium burning is not able to penetrate the hydrogen-rich envelope from below because the entropy jump across the helium/hydrogen interface is too large. Only when the star evolves back to its Hayashi limit on the AGB (Teff≲ 7000 K), envelope convection sets in again (Blöcker & Schönberner 1996, 1997; Schönberner 2008). Therefore, the surface abundances of SAO 244567 are in agree with the LTP scenario. The evolutionary calculations of Blöcker (2001) for a 0.625 M⊙ LTP star predict that the solar surface composition of the star holds up after the LTP. Only when the star has cooled down to Teff = 10 kK, the H abundance decreases while the He and C abundances increase. The LTP scenario is able to explain the rapid evolution (increase in Teff and drop in luminosity). It would predict a decrease in Teff (the FUSE observation in 2006 already suggests that) and an increase in the brightness within the next decades (similar to the evolution of FG Sge). The LTP is a good candidate for explaining the evolutionary status of SAO 244567; however, concrete evolutionary models that match the position of SAO 244567 in the log Teff–log g plane, are missing to prove this scenario.
Considering SAO 244567 as an AGB-manqué star, which ignited central He-burning, we derive a mass of 0.49 M⊙ according to the tracks of Dorman et al. (1993). Within this scenario the existence of the PN and the short evolutionary time scales are even more difficult to explain. Even if the RGB precursor would have ejected a PN, it should have disappeared a long time ago since the horizontal branch (HB) evolution lasts ≈108 years. It is worthwhile mentioning that the mass of the remaining H layer (≤0.001 M⊙) of extended horizontal branch (EHB) stars is much too low to produce a nebula at the end of the HB stage. We can also rule out an early hot-flasher scenario. Brown et al. (2001) found that as the Reimers mass-loss parameter ηR increases, the peak of the main helium core flash shifts to higher temperatures, and the subsequent zero age horizontal branch (ZAHB) position becomes hotter. However their models never produced stars with a ZAHB position hotter than Teff = 31.5 kK.
Recently Hall et al. (2013) have proposed that it is possible that at least some PNe are composed of matter ejected from a binary star system during common envelope (CE) evolution. For these PNe, the ionizing component is the hot and luminous remnant of a giant that had its envelope ejected by a companion in the process of spiraling in to its current short-period orbit. A large fraction of CE phases that end with ejection of the envelope are thought to be initiated by low-mass red giants, giants with inert, degenerate helium cores. In their calculations Hall et al. (2013) find, that PNe are expected in post-CE systems with core masses greater than about 0.3 M⊙ if remnants end the CE phase in thermal equilibrium. Considering this scenario for SAO 244567, we estimate a mass of 0.354 ± 0.03 M⊙. The rapid evolution of SAO 244567, though, is also not predicted in their models. A higher mass-loss rate might increase the evolutionary speed, but there are no hints of any enhanced mass loss in the observations. However, if the remnant is in thermal non-equilibrium after the CE ejection, it might evolve rapidly enough (Philip Hall, priv. comm.).
The current decrease in Teff of SAO 244567 from 2002 on found in our work and also by Arkhipova et al. (2013) argues for post-RGB evolution instead of the post-EHB evolution, since the H-shell-burning models cool down directly, whereas the He-core burning post-EHB models become even hotter (Fig. 13).
The bipolar shape of the PN is most likely due to some kind of binary interaction of a RGB or AGB star with either a stellar or substellar companion. This was already suggested by Bobrowsky (1994) to explain the axisymmetric structure of SAO 244567. Soker (1997) proposed that bipolar structures of PNe, as seen in SAO 244567, can be explained by close binary interactions that avoid a CE phase, or they entered this phase only in their late evolution. The gravitational interaction between the companion and the PN progenitor and/or their winds are non-negligible. The companion’s tidal force can spin up the primary and enhance the mass-loss rate or the companion can accrete mass from the primary’s wind. This accretion process is likely to result in a high mass-loss rate in the equatorial plane, leading to a bipolar PN. The possible companion detected by Bobrowsky et al. (1998), however, is too far away (638 AU at a distance of 1.6 kpc) for significant interaction with SAO 244567. But it might be possible that SAO 244567 has another, hitherto undetected companion.
4.3. Comparison with other low-mass CSPNe
SAO 244567 is not the only low-mass CSPN. Napiwotzki (1999) found five such candidates (HDW 11, K 2−2, GD 561, PHL 932, and DeHt 5) that are not in accordance with post-AGB evolution. For the DA-type WD DeHt 5 (M = 0.414 M⊙), they considered a post-RGB evolution as the kinematical age of the PN (≈129 000 yrs) is in good agreement with the post-RGB age (≈100 000 yrs) estimated from the calculations of Driebe et al. (1998). The two DAO-type WDs K 2−2 (M = 0.39 M⊙) and HDW 11 (M = 0.38 M⊙) are also candidates for this evolutionary scenario.
For PHL 932 and EGB 5, an object with similar parameters, the post-RGB times corresponding to the tracks of Driebe et al. (1998) are much longer than the ages of the PNe. The PN EGB 5 is believed to be a remnant of an ejected CE. Geier et al. (2011) discovered a close low-mass companion orbiting the sdB central star and thus EGB 5 is considered to be a good candidate for a post-CE object. Napiwotzki (1999) considered PHL 932 (M = 0.28 M⊙) to be the outcome of a CE event of a star with a degenerate CO core as calculated by Iben & Tutukov (1985) or even as the result of a merger within a common envelope (Méndez et al. 1988b). However Frew et al. (2010) convincingly demonstrate that the nebula around PHL 932 is not a PN, but rather a Strömgren sphere in the ambient ISM. Also EGB 5 has recently been classified as an ionized H II region (Frew et al. 2013). The same holds for the nebulae around the DAO-type WDs GD 561 and BD-22°3467 (Ziegler et al. 2012), which Frew & Parker (2010) also consider to be Strömgren spheres. Other objects of this type are the sdO stars HD 497898, LSS 630, LSE 44, LSE 153, SB 705, and KPD 0720−0003 around which nebulosities were detected that are not believed to be ejected by or physically associated with the corresponding stars (Méndez et al. 1988a). This can clearly not be true for SAO 244567 owing to its complex nebula structure and the expansion velocity.
A multi-shell planetary nebula around the hot sdO star 2MASS J19310888+4324577 has recently been detected (Aller et al. 2013). The morphology of the nebula (bipolar and elliptical shell, whose major axes are oriented perpendicular to each other) strongly resembles the one of the Stingray nebula. The complex nebula structure and the fact that 2MASS J19310888+4324577 was found to be in a binary system (Jacoby et al. 2012) suggest that it might have formed through binary star evolution.
5. Conclusions
SAO 244567 is a rapidly evolving object. Its evolutionary status remains unclear. The most reasonable explanations are a late He-shell flash or CE evolution with a remnant that is in thermal non-equilibrium after the CE ejection. However, respective models are lacking that match the position of SAO 244567 in the log Teff–log g plane. The contradiction between observations and theory make SAO 244567 particularly interesting. Its fast evolution gives us the unique opportunity to study stellar evolution in real time and establishes constraints for stellar evolutionary theory. Further observations, in the next years, decades and even centuries, are essential for monitoring whether the rapid evolution of SAO 244567 is still going on and to see if it is directly evolving to the white dwarf domain or back to the AGB. The detection of a close binary would support the scenario of a CE ejection, whereas an increase in brightness and decrease in Teff over the next decades, would indicate an evolution back to the AGB and hence speak for a LTP scenario.
Online material
Observations of SAO 244567.
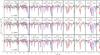 |
Fig. 4 Determination of Teff using the ionization equilibria of N, O, S and C in the FUSE spectrum taken in 2002. The red (thick) lines indicate the pure stellar spectrum, the blue (thin) lines also include the interstellar lines. N iii–iv, O iii–v, S iv–vi and C iii–iv lines are marked. |
Statistics of our model atoms.
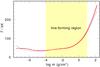 |
Fig. 6 Comparison of the temperature structures of a HHeCNO (blue, thin) and the final HHeCNONeSiPSFeNi model (red, thick) with Teff = 60 kK and log g = 6.0. |
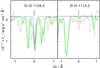 |
Fig. 7 Determination of the Si abundance. Synthetic line profiles calculated from models with 0.1× solar (blue, dashed), solar (green, light gray, including ISM absorption lines), and 10× solar (red, dark) Si abundance are compared with the observed Si iv (left) and Si iii (right) line profiles. |
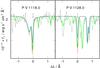 |
Fig. 8 Determination of the P abundance. Synthetic line profiles calculated from models with 0.01× solar (blue, dashed), 0.1× solar (green, light gray, including ISM absorption lines), and solar (red, dark) P abundance are compared with the observed P v line profiles. |
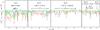 |
Fig. 9 Determination of the Fe abundance and the upper limit for the Ni abundance. Synthetic spectra calculated from models with 0.1× solar (blue, dashed), solar (green, light) and 10× solar (red, dark) Fe and Ni abundances are compared with the observation. |
International Ultraviolet Explorer.
Far Ultraviolet Spectroscopic Explorer.
Hubble Space Telescope/Space Telescope Imaging Spectrograph.
Faint Object Spectrograph.
Acknowledgments
N.R. is supported by the German Research Foundation (DFG, grant WE 1312/41-1), TR by the German Aerospace Center (DLR, grant 05 OR 0806). We thank Marcelo Miguel Miller Bertolami and Philip Hall for helpful discussions and comments. M.P. is grateful to Profs. Ajit K. Kembhavi, Kandaswamy Subramanian and T. Padmanabhan for their kind encouragement, support, and hospitality. This research has made use of the SIMBAD database, operated at the CDS, Strasbourg, France. This research made use of NASA’s Astrophysics Data System. This work used the profile-fitting procedure OWENS developed by M. Lemoine and the French FUSE Team. Some of the data presented in this paper were obtained from the Mikulski Archive for Space Telescopes (MAST). STScI is operated by the Association of Universities for Research in Astronomy, Inc., under NASA contract NAS5-26555. Support for MAST for non-HST data is provided by the NASA Office of Space Science via grant NNX13AC07G and by other grants and contracts.
References
- Aller, A., Miranda, L. F., Ulla, A., et al. 2013, A&A, 552, A25 [NASA ADS] [CrossRef] [EDP Sciences] [Google Scholar]
- Arkhipova, V. P., Ikonnikova, N. P., Kniazev, A. Y., & Rajoelimanana, A. 2013, Astron. Lett., 39, 201 [NASA ADS] [CrossRef] [Google Scholar]
- Asplund, M., Grevesse, N., Sauval, A. J., & Scott, P. 2009, ARA&A, 47, 481 [NASA ADS] [CrossRef] [Google Scholar]
- Blöcker, T. 1995, A&A, 299, 755 [NASA ADS] [Google Scholar]
- Blöcker, T. 2001, Ap&SS, 275, 1 [NASA ADS] [CrossRef] [Google Scholar]
- Blöcker, T., & Schönberner, D. 1996, Mem. Soc. Astron. It., 67, 665 [NASA ADS] [Google Scholar]
- Blöcker, T., & Schönberner, D. 1997, A&A, 324, 991 [NASA ADS] [Google Scholar]
- Bobrowsky, M. 1994, ApJ, 426, L47 [NASA ADS] [CrossRef] [Google Scholar]
- Bobrowsky, M., Sahu, K. C., Parthasarathy, M., & García-Lario, P. 1998, Nature, 392, 469 [NASA ADS] [CrossRef] [Google Scholar]
- Brown, T. M., Sweigart, A. V., Lanz, T., Landsman, W. B., & Hubeny, I. 2001, ApJ, 562, 368 [NASA ADS] [CrossRef] [Google Scholar]
- Clayton, G. C., Kerber, F., Pirzkal, N., et al. 2006, ApJ, 646, L69 [NASA ADS] [CrossRef] [Google Scholar]
- Dorman, B., Rood, R. T., & O’Connell, R. W. 1993, ApJ, 419, 596 [CrossRef] [Google Scholar]
- Driebe, T., Schönberner, D., Blöcker, T., & Herwig, F. 1998, A&A, 339, 123 [NASA ADS] [Google Scholar]
- Fitzpatrick, E. L. 1999, PASP, 111, 63 [NASA ADS] [CrossRef] [Google Scholar]
- Frew, D. J., & Parker, Q. A. 2010, PASA, 27, 129 [NASA ADS] [CrossRef] [Google Scholar]
- Frew, D. J., Madsen, G. J., O’Toole, S. J., & Parker, Q. A. 2010, PASA, 27, 203 [NASA ADS] [CrossRef] [Google Scholar]
- Frew, D. J., Bojičić, I. S., & Parker, Q. A. 2013, MNRAS, 431, 2 [NASA ADS] [CrossRef] [Google Scholar]
- Geier, S., Napiwotzki, R., Heber, U., & Nelemans, G. 2011, A&A, 528, L16 [NASA ADS] [CrossRef] [EDP Sciences] [Google Scholar]
- Gräfener, G., Koesterke, L., & Hamann, W.-R. 2002, A&A, 387, 244 [NASA ADS] [CrossRef] [EDP Sciences] [Google Scholar]
- Hajduk, M., Zijlstra, A. A., Herwig, F., et al. 2005, Science, 308, 231 [NASA ADS] [CrossRef] [PubMed] [Google Scholar]
- Hall, P. D., Tout, C. A., Izzard, R. G., & Keller, D. 2013, MNRAS, 435, 2048 [NASA ADS] [CrossRef] [Google Scholar]
- Hamann, W.-R., & Gräfener, G. 2003, A&A, 410, 993 [NASA ADS] [CrossRef] [EDP Sciences] [Google Scholar]
- Hamann, W.-R., & Gräfener, G. 2004, A&A, 427, 697 [NASA ADS] [CrossRef] [EDP Sciences] [Google Scholar]
- Heber, U., Hunger, K., Jonas, G., & Kudritzki, R. P. 1984, A&A, 130, 119 [NASA ADS] [Google Scholar]
- Henize, K. G. 1976, ApJS, 30, 491 [NASA ADS] [CrossRef] [Google Scholar]
- Herald, J. E., & Bianchi, L. 2007, ApJ, 661, 845 [NASA ADS] [CrossRef] [Google Scholar]
- Herald, J. E., & Bianchi, L. 2011, MNRAS, 417, 2440 [NASA ADS] [CrossRef] [Google Scholar]
- Howarth, I. D. 1983, MNRAS, 203, 301 [NASA ADS] [CrossRef] [Google Scholar]
- Iben, Jr., I., & Tutukov, A. V. 1985, ApJS, 58, 661 [NASA ADS] [CrossRef] [Google Scholar]
- Jacoby, G., De Marco, O., Howell, S., & Kronberger, M. 2012, in AAS Meeting Abstracts, 219, 41802 [Google Scholar]
- Jeffery, C. S., & Schönberner, D. 2006, A&A, 459, 885 [NASA ADS] [CrossRef] [EDP Sciences] [Google Scholar]
- Kaler, J. B. 1978, ApJ, 220, 887 [NASA ADS] [CrossRef] [Google Scholar]
- Kozok, J. R. 1985a, A&AS, 62, 7 [NASA ADS] [Google Scholar]
- Kozok, J. R. 1985b, A&AS, 61, 387 [NASA ADS] [Google Scholar]
- Mello, D. R. C., Daflon, S., Pereira, C. B., & Hubeny, I. 2012, A&A, 543, A11 [NASA ADS] [CrossRef] [EDP Sciences] [Google Scholar]
- Méndez, R.-H., Gathier, R., Simon, K. P., & Kwitter, K. B. 1988a, A&A, 198, 287 [NASA ADS] [Google Scholar]
- Méndez, R. H., Kudritzki, R. P., Groth, H. G., Husfeld, D., & Herrero, A. 1988b, A&A, 197, L25 [NASA ADS] [Google Scholar]
- Müller-Ringat, E. 2013, Dissertation, University of Tübingen, Germany, http://tobias-lib.uni-tuebingen.de/volltexte/2013/6774/ [Google Scholar]
- Napiwotzki, R. 1999, A&A, 350, 101 [Google Scholar]
- Parthasarathy, M., Garcia-Lario, P., de Martino, D., et al. 1995, A&A, 300, L25 [NASA ADS] [Google Scholar]
- Parthasarathy, M., & Pottasch, S. R. 1989, A&A, 225, 521 [NASA ADS] [Google Scholar]
- Parthasarathy, M., Garcia-Lario, P., Pottasch, S. R., et al. 1993, A&A, 267, L19 [NASA ADS] [Google Scholar]
- Rauch, T. & Deetjen, J. L. 2003, in Stellar Atmosphere Modeling, eds. I. Hubeny, D. Mihalas, & K. Werner, ASP Conf. Ser., 288, 103 [Google Scholar]
- Schönberner, D. 2008, in Hydrogen-Deficient Stars, eds. A. Werner, & T. Rauch, ASP Conf. Ser., 391, 139 [Google Scholar]
- Soker, N. 1997, ApJS, 112, 487 [NASA ADS] [CrossRef] [Google Scholar]
- Umana, G., Trigilio, C., Cerrigone, L., Buemi, C. S., & Leto, P. 2008, MNRAS, 386, 1404 [NASA ADS] [CrossRef] [Google Scholar]
- Vink, J. S., & Cassisi, S. 2002, A&A, 392, 553 [NASA ADS] [CrossRef] [EDP Sciences] [Google Scholar]
- Werner, K., Deetjen, J. L., Dreizler, S., et al. 2003, in Stellar Atmosphere Modeling, eds. I. Hubeny, D. Mihalas, & K. Werner, ASP Conf. Ser., 288, 31 [Google Scholar]
- Ziegler, M., Rauch, T., Werner, K., Köppen, J., & Kruk, J. W. 2012, A&A, 548, A109 [NASA ADS] [CrossRef] [EDP Sciences] [Google Scholar]
All Tables
Temporal evolution of the atmospheric parameters as derived from our spectral analysis.
Comparison of the element abundances (number fractions relatively to H) of SAO 244567 (CS) as derived by our analysis and of its PN as derived by analysis of the spectrum in 1990 (Parthasarathy et al. 1993), 1992, and 2011 (Arkhipova et al. 2013).
All Figures
|
Fig. 1 All reliably flux-calibrated observations of SAO 244567. |
| In the text | |
|
Fig. 2 Example for the determination of EB − V for SAO 244567. The FOS observation (gray) is compared to TMAW model fluxes with different corrections for the interstellar reddening. The thick (red in online version) line represents the TMAW model corrected with EB − V = 0.14, the dashed lines (blue) indicate the error limits. |
| In the text | |
|
Fig. 3 Comparison of our best-fit TMAP models (black, red in online version) to the FOS and STIS observation (gray). He ii, C iii–iv, and interstellar Fe ii lines are marked. The vertical bar indicates 10% of the continuum flux. |
| In the text | |
|
Fig. 10 Comparison of the IUE spectra taken from 1988 to 1996 (thin, gray) with the best-fit PoWR model (thick, red). All but the 1988 observation are shifted for clarity. |
| In the text | |
|
Fig. 11 Comparison the FUSE spectra taken in 2002 and 2006 (gray) with the best-fit PoWR model (thick, red). The blue line (thin) indicates the combined stellar and ISM spectrum. |
| In the text | |
|
Fig. 12 Temporal evolution of Teff, log g, mass-loss rate Ṁ, and the terminal wind velocities v∞ as derived in our analysis (red). The black stars in the bottom panel show the Teff as derived by Arkhipova et al. (2013), the black square indicates the Teff estimate when SAO 244567 was still a B-type supergiant (1971). |
| In the text | |
|
Fig. 13 Evolution of SAO 244567 (black dots) in the log Teff–log g plane compared to post-AGB (red, thick) by Blöcker (1995), post-EHB (blue, thin) by Dorman et al. (1993), and post-RGB (green, dashed) evolutionary tracks by Hall et al. (2013) The tracks are labeled with stellar masses. The ellipse indicates the errors of Teff and log g in 1997. |
| In the text | |
|
Fig. 4 Determination of Teff using the ionization equilibria of N, O, S and C in the FUSE spectrum taken in 2002. The red (thick) lines indicate the pure stellar spectrum, the blue (thin) lines also include the interstellar lines. N iii–iv, O iii–v, S iv–vi and C iii–iv lines are marked. |
| In the text | |
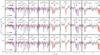 |
Fig. 5 Same as Fig. 4, but for the year 2006. |
| In the text | |
|
Fig. 6 Comparison of the temperature structures of a HHeCNO (blue, thin) and the final HHeCNONeSiPSFeNi model (red, thick) with Teff = 60 kK and log g = 6.0. |
| In the text | |
|
Fig. 7 Determination of the Si abundance. Synthetic line profiles calculated from models with 0.1× solar (blue, dashed), solar (green, light gray, including ISM absorption lines), and 10× solar (red, dark) Si abundance are compared with the observed Si iv (left) and Si iii (right) line profiles. |
| In the text | |
|
Fig. 8 Determination of the P abundance. Synthetic line profiles calculated from models with 0.01× solar (blue, dashed), 0.1× solar (green, light gray, including ISM absorption lines), and solar (red, dark) P abundance are compared with the observed P v line profiles. |
| In the text | |
|
Fig. 9 Determination of the Fe abundance and the upper limit for the Ni abundance. Synthetic spectra calculated from models with 0.1× solar (blue, dashed), solar (green, light) and 10× solar (red, dark) Fe and Ni abundances are compared with the observation. |
| In the text | |
Current usage metrics show cumulative count of Article Views (full-text article views including HTML views, PDF and ePub downloads, according to the available data) and Abstracts Views on Vision4Press platform.
Data correspond to usage on the plateform after 2015. The current usage metrics is available 48-96 hours after online publication and is updated daily on week days.
Initial download of the metrics may take a while.