Free Access
Fig. 4
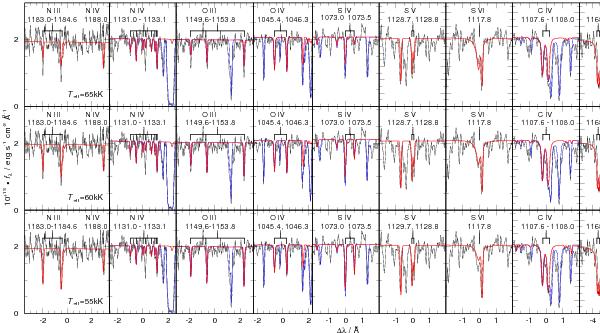
Determination of Teff using the ionization equilibria of N, O, S and C in the FUSE spectrum taken in 2002. The red (thick) lines indicate the pure stellar spectrum, the blue (thin) lines also include the interstellar lines. N iii–iv, O iii–v, S iv–vi and C iii–iv lines are marked.
Current usage metrics show cumulative count of Article Views (full-text article views including HTML views, PDF and ePub downloads, according to the available data) and Abstracts Views on Vision4Press platform.
Data correspond to usage on the plateform after 2015. The current usage metrics is available 48-96 hours after online publication and is updated daily on week days.
Initial download of the metrics may take a while.