Fig. 13
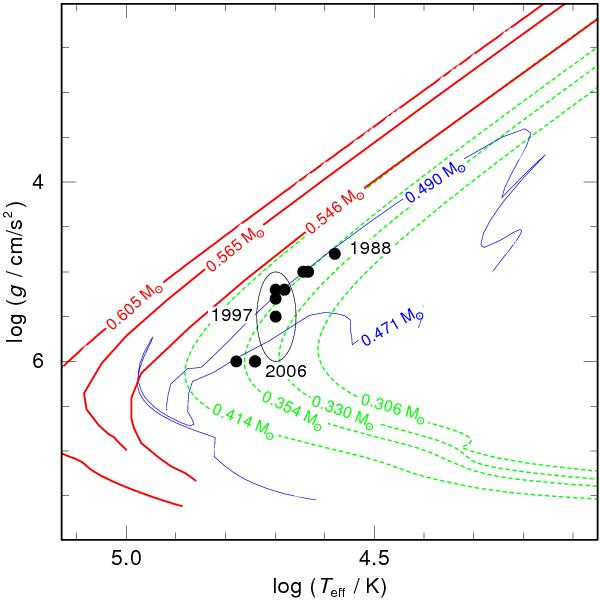
Evolution of SAO 244567 (black dots) in the log Teff–log g plane compared to post-AGB (red, thick) by Blöcker (1995), post-EHB (blue, thin) by Dorman et al. (1993), and post-RGB (green, dashed) evolutionary tracks by Hall et al. (2013) The tracks are labeled with stellar masses. The ellipse indicates the errors of Teff and log g in 1997.
Current usage metrics show cumulative count of Article Views (full-text article views including HTML views, PDF and ePub downloads, according to the available data) and Abstracts Views on Vision4Press platform.
Data correspond to usage on the plateform after 2015. The current usage metrics is available 48-96 hours after online publication and is updated daily on week days.
Initial download of the metrics may take a while.