| Issue |
A&A
Volume 547, November 2012
|
|
|---|---|---|
| Article Number | A16 | |
| Number of page(s) | 6 | |
| Section | Cosmology (including clusters of galaxies) | |
| DOI | https://doi.org/10.1051/0004-6361/201218986 | |
| Published online | 19 October 2012 | |
Disentangling cosmic-ray and dark-matter induced γ-rays in galaxy clusters
1
Laboratoire de Physique Subatomique et de Cosmologie, Université Joseph
Fourier Grenoble 1/CNRS/IN2P3/INPG,
53 avenue des Martyrs,
38026
Grenoble,
France
e-mail: This email address is being protected from spambots. You need JavaScript enabled to view it.
2
Aix Marseille Université, CNRS, LAM (Laboratoire d’Astrophysique
de Marseille), UMR 7326, 13388
Marseille,
France
3
CNRS, IRAP, 14
avenue Edouard Belin, 31400
Toulouse,
France
4
Université de Toulouse, UPS-OMP, IRAP, 31400
Toulouse,
France
Received:
8
February
2012
Accepted:
12
September
2012
Abstract
Context. Galaxy clusters are among the best targets for indirect dark matter detection in γ-rays, despite the large astrophysical background expected from these objects. Detection is now within reach of current observatories (Fermi-LAT or Cerenkov telescopes); however, assessing the origin of this signal might be difficult.
Aims. We investigate whether the behaviour of the number of objects per “flux” bin (log N − log F) and that of the stacked signal could be used as a signature of the dominant process at stake.
Methods. We use the Clumpy code to integrate the signal from decaying or annihilating dark matter and from cosmic rays along the line of sight. We assume the standard Navarro-Frenk-White (NFW) profile for the dark matter density and rely on a parametrised emissivity for the cosmic-ray component. In this context, the consequences of stacking are explored using the MCXC meta-catalogue of galaxy clusters.
Results. We find the value of the slope of the log N − log F power law (or the increase of the signal with the number of stacked objects) to be a clear diagnosis to disentangle decaying dark matter from cosmic-ray induced γ-rays. For dark matter annihilation, depending on the signal boost from the substructures, it is either similar to the cosmic-ray signal (no boost) or similar to the decay case (large boosts). The shift between the brightest object and its followers also depends on the signal origin. For annihilation, this shift and the stacked signal are poorly constrained because of the large uncertainty affecting the boost. We also underline that the angular dependence of the annihilation signal is not universal because of the substructure contribution.
Key words: astroparticle physics / galaxies: clusters: general / gamma rays: galaxies: clusters / dark matter / cosmic rays
© ESO, 2012
1. Introduction
Contamination by astrophysical backgrounds is the curse of dark matter (DM) indirect detection searches. Ways around this issue are multi-wavelength (Regis & Ullio 2008) or/and multi-messenger (Pato et al. 2009) analyses. In γ-rays, background-free objects such as dwarf spheroidal galaxies (dSphs) are another option (Walker et al. 2011). For targets presenting an astrophysical background, a useful diagnosis comes from the spectral behaviour, which differs for DM-induced or cosmic-ray (CR)-induced γ-rays: DM signals should exhibit a sharp cut-off at the DM mass (Bringmann et al. 2011), whereas astrophysical processes produce power laws with a slope ~2−3 (the cut-off energy depends on the source). For instance, the Galactic centre signal observed by the High Energy Stereoscopic System (H.E.S.S., Aharonian et al. 2004) is consistent with astrophysical sources. Despite their astrophysical background, galaxy clusters are also promising DM targets in γ-rays (or at radio and microwave frequencies) as first proposed in Colafrancesco et al. (2006). Cerenkov instruments have set constraints on a DM signal or astrophysical background from the non-detection in several of these objects: Perseus and Abell 2029 from Whipple (Perkins et al. 2006); Abell 3667 and 4038 from Kangaroo (Kiuchi et al. 2009); Coma, Abell 496 and 85 from H.E.S.S. (Aharonian et al. 2009a,b). A broader survey has been made by the Fermi-LAT instrument, where 33 (resp. 49) clusters were analysed in Ackermann et al. (2010) (resp. Ando & Nagai 2012). The consequences for hadronic models are discussed, e.g. in Jeltema & Profumo (2011). Recently, a detection was reported by the MAGIC collaboration in the Perseus Cluster. However, this signal, also detected by Fermi-LAT (Abdo et al. 2009), is consistent with an emission from the giant elliptical galaxy NGC 1275 lying at its centre (Aleksić et al. 2010, 2012). From the Fermi-LAT results, Colafrancesco et al. (2010) argue that it should be possible to resolve and detect the diffuse γ-ray flux of astrophysical origin coming from the outer corona of the Perseus cluster. Even more recently, Han et al. (2012) reported a detection for Virgo, Fornax, and Coma from an analysis of Fermi-LAT data. These authors find that an interpretation in terms of DM annihilation is preferred by their analysis, although a CR origin is also possible.
From these promising results, we anticipate that many clusters will be detected with the current or the next generation of γ-ray instruments. Multi-wavelength analyses, search for a spectral feature, and angular dependence of the signal are tests to disentangle γ-rays of astrophysical or DM origin. In this paper, we investigate another test based on the study of a population of sources, thus somehow positioned between single source and full sky power-spectrum analyses (Ando & Komatsu 2006). Actually, several studies have compared the astrophysical and DM annihilation signal (Jeltema et al. 2009; Pinzke et al. 2011) as well as DM annihilation and decay (Huang et al. 2012) on a somewhat limited number of clusters (due to the size of the available catalogues at the time). However, the systematic study of the prospects of a stacking analysis with respect to single-source analyses has not been investigated before.
This paper is part of an ongoing effort to address this question in the context of the recently assembled MCXC meta-catalogue of 1743 X-ray clusters (Piffaretti et al. 2011). A first paper in this series highlighted the potential improvement (a factor ≳ 5–100) that can be brought by a stacking analysis over a single-source analysis for the DM decay case (Combet et al. 2012). A second paper considered the DM annihilation case in the light of the sensitivity of existing and future γ-ray instruments (Nezri et al. 2012). It showed that stacking only brings a factor of ~2 improvement in sensitivity for the Fermi-LAT instrument, but no improvement for Cherenkov Telescope Array (CTA)-like observatories. This third and last paper of the series inspects the case of the CR signal to address the possibility of using a stacking strategy to disentangle it from DM-induced signals. For that purpose, we use a generic description of the CR signal and refer the reader to the two previous papers (Combet et al. 2012; Nezri et al. 2012) for a detailed description of the DM modelling. We stress that this study remains at the phenomenological level. We are waiting either for the detection of several objects or a better knowledge of the input ingredients in order to quantify further the potential of the new diagnosis we investigate.
We present the ingredients and the calculation in Sect. 2. We then present the results in Sect. 3 and conclude in Sect. 4.
2. Ingredients and calculation
The total flux expected in a given direction (l,b) (Galactic coordinates)
and integrated over the solid angle ΔΩ is given by the product of an energy-dependent term
with an astrophysical term  1,
1, 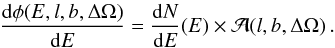 (1)In this study, we
discard the spectral term and focus on ,
which encodes all the information about the spatial dependence of the signal, and the
relative intensity between clusters.
will be termed “flux” in the following, but should be understood as the astrophysical
contribution to the actual γ-ray flux. For an observation in the direction
of the cluster’s centre
(lcl,bcl) and
using an integration angle αint,
(1)In this study, we
discard the spectral term and focus on ,
which encodes all the information about the spatial dependence of the signal, and the
relative intensity between clusters.
will be termed “flux” in the following, but should be understood as the astrophysical
contribution to the actual γ-ray flux. For an observation in the direction
of the cluster’s centre
(lcl,bcl) and
using an integration angle αint, 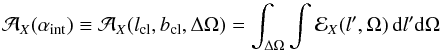 (2)is the integral of
the “emissivity”
ℰX(l′,Ω), over
line of sight l′ and solid angle
ΔΩ = 2π·(1 − cos(αint)) for the process
X. For DM, ℰDecay = ρDM for decay
and
(2)is the integral of
the “emissivity”
ℰX(l′,Ω), over
line of sight l′ and solid angle
ΔΩ = 2π·(1 − cos(αint)) for the process
X. For DM, ℰDecay = ρDM for decay
and  for
annihilation, where ρDM is the DM density profile in the galaxy
cluster, as presented in Sect. 2.1. For CR,
ℰCR = CCR, as defined in Sect. 2.2.
for
annihilation, where ρDM is the DM density profile in the galaxy
cluster, as presented in Sect. 2.1. For CR,
ℰCR = CCR, as defined in Sect. 2.2.
The integral Eq. (2) is computed for all MCXC clusters with the Clumpy2 code v2011.09 (Charbonnier et al. 2012) adapted to include the CR-induced γ-ray case described below.
2.1. Dark matter halos
The DM distribution for each galaxy cluster is parametrised from (see Combet et al. 2012 for more details):
-
its M500 value3 provided in the MCXC catalogue (Piffaretti et al. 2011);
-
the choice of a universal DM profile, here the widely used NFW profile (Navarro et al. 1997),
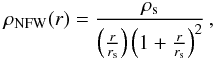 (3)where
rs is the scale radius and
ρs is the normalisation;
(3)where
rs is the scale radius and
ρs is the normalisation; -
a mass-concentration relationship, where the concentration is defined to be cΔ ≡ RΔ/rs for an NFW profile4. The latter is observationally constrained at the cluster scale (Pointecouteau et al. 2005; Buote et al. 2007; Ettori et al. 2010), and it has also been extensively studied in numerical simulations (Wechsler et al. 2002, 2006; Zhao et al. 2003, 2009; Neto et al. 2007; Gao et al. 2008, 2011; Macciò et al. 2008; Duffy et al. 2008, 2010; Giocoli et al. 2010; Muñoz-Cuartas et al. 2011; Klypin et al. 2011). In this study, we use the parametrisation of Duffy et al. (2008).
For DM annihilation, we also have to take into account the contribution from substructures as they have been shown to boost the signal. In this work, we assume the following for the mass and spatial distribution of the substructures: i) dNsubs/dM ∝ M − αM with αM = 1.9, a mass fraction fDM = 10% in substructures (Springel et al. 2008), a minimal and maximal mass of 10-6 M⊙ and 10-2 Mcluster respectively, and the Bullock et al. (2001) concentration (down to the minimal mass); ii) the substructure spatial distribution dNsubs/dV follows the host halo smooth profile. Recent high-resolution numerical simulations that are for Galaxy-like objects (Springel et al. 2008) or are dedicated to cluster-size halos (Gao et al. 2012b) provide different figures for the slope αM, the mass fraction fDM, and the spatial distribution of substructures. We will briefly comment on how other choices impact on our analysis5.
2.2. Cosmic-ray component
High-energy γ-rays can also be produced from astrophysical processes, in
particular from the interaction of cosmic-ray protons with the gas of the cluster. Pinzke & Pfrommer (2010) found a universal
radial dependence of the emissivity
ℰCR ≡ CCR(r) of the clusters
based on cosmological simulations. These authors acknowledge, however, that the CR spatial
distribution from which γ-rays are emitted could be affected by, e.g.
additional CRs injected from AGN, or CR diffusion in momentum and space. For instance,
Enßlin et al. (2011) argue that merging clusters
should have a more centrally concentrated CR population than relaxed ones, providing
bi-modality of their γ-ray emissivities. Nevertheless, we limit ourselves
to the simplest case and assume a universal dependence across the cluster population we
study here. We follow the formalism from Pinzke &
Pfrommer (2010) and Pinzke et al. (2011):
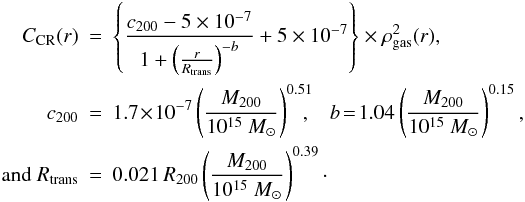 (4)Similar
to the X-ray luminosity, the γ-ray emissivity is proportional to the
square of the gas density
(4)Similar
to the X-ray luminosity, the γ-ray emissivity is proportional to the
square of the gas density  . It is thereby very sensitive
to the densest central parts of clusters. The relation between the DM and
ρgas(r) has been extensively studied from a
theoretical point of view (Makino et al. 1998;
Suto et al. 1998; Komatsu & Seljak 2001; Ostriker et al.
2005; Bode et al. 2009; Frederiksen et al. 2009; Capelo et al. 2012). From the REXCESS representative sample, Croston et al. (2008) showed the universal behaviour of
ρgas(r) in clusters (though a large scatter
exists at the centre). The AB model, first introduced by Pratt & Arnaud (2002), and given by
. It is thereby very sensitive
to the densest central parts of clusters. The relation between the DM and
ρgas(r) has been extensively studied from a
theoretical point of view (Makino et al. 1998;
Suto et al. 1998; Komatsu & Seljak 2001; Ostriker et al.
2005; Bode et al. 2009; Frederiksen et al. 2009; Capelo et al. 2012). From the REXCESS representative sample, Croston et al. (2008) showed the universal behaviour of
ρgas(r) in clusters (though a large scatter
exists at the centre). The AB model, first introduced by Pratt & Arnaud (2002), and given by ![Mathematical equation: \begin{equation} \label{eq:gas} \rho_{\rm gas}(x) \propto \left(\frac{x}{x_{\rm c}}\right)^{-k_1} \left[ 1+\left(\frac{x}{x_{\rm c}}\right)^2\right]^{-3k_2/2 + k_1/2} \end{equation}](/articles/aa/full_html/2012/11/aa18986-12/aa18986-12-eq39.png) (5)with
x ≡ r/R500,
was fitted to the average REXCESS density profile by Arnaud et al. (2010), with best-fit parameters
xc = 0.303, k1 = 0.525, and
k2 = 0.768. This analytical phenomenological model
reproduces well the cuspy shape of density profiles derived from X-ray observations and
was also used for the MCXC assembly (Piffaretti et al.
2011). In order to remain consistent with respect to the data we use, the same AB
profile is used here. The normalisation of Eq. (5) is chosen to give
fgasM500 at
R500. From the MCXC masses M500
and the empirical relation between fgas and
M500 given for the REXCESS sample (Pratt et al. 2009), an average value of
fgas = 0.10 ± 0.06 is derived, which we use for the whole
MCXC sample. We note that the gas fraction increases with radius in halos (to ultimately
tends towards the cosmic value), and the intrinsic scatter is important and scales with
the cluster mass (Vikhlinin et al. 2006; Ettori et al. 2009; Pratt et al. 2009, 2010).
(5)with
x ≡ r/R500,
was fitted to the average REXCESS density profile by Arnaud et al. (2010), with best-fit parameters
xc = 0.303, k1 = 0.525, and
k2 = 0.768. This analytical phenomenological model
reproduces well the cuspy shape of density profiles derived from X-ray observations and
was also used for the MCXC assembly (Piffaretti et al.
2011). In order to remain consistent with respect to the data we use, the same AB
profile is used here. The normalisation of Eq. (5) is chosen to give
fgasM500 at
R500. From the MCXC masses M500
and the empirical relation between fgas and
M500 given for the REXCESS sample (Pratt et al. 2009), an average value of
fgas = 0.10 ± 0.06 is derived, which we use for the whole
MCXC sample. We note that the gas fraction increases with radius in halos (to ultimately
tends towards the cosmic value), and the intrinsic scatter is important and scales with
the cluster mass (Vikhlinin et al. 2006; Ettori et al. 2009; Pratt et al. 2009, 2010).
3. Results
We first comment on the universality of the γ-ray signal angular dependence. In particular, we inspect whether this universality holds for any signal hypothesis (annihilating DM, decaying DM, or CRs); in that case, observations of different objects may be optimally stacked to increase the signal. We also inspect whether a given angular dependence can be associated to a unique signal origin. We then turn to the comparison of the galaxy cluster population signals.
3.1. A different angular dependence for different origins?
The spatial dependence of the signal has been suggested as a test to disentangle DM decay from annihilation, in particular in dSphs (Palomares-Ruiz & Siegal-Gaskins 2010). Indeed, the use of universal DM profiles ensures that the projected profiles are universal if properly normalised by their value at r = rs. By construction, the projected profiles for decay are universal, and so they are for annihilation if the smooth signal only is taken into account. However, as can be deduced from Gao et al. (2012a) results and as underlined in Nezri et al. (2012), the substructure contribution overtakes the smooth contribution at various distances from the centre, depending on the mass of the object rather than on its scale radius. Small objects (like dSphs) are dominated by their smooth contribution up to large distances from their centre, whereas massive galaxy clusters are almost completely dominated by the substructure contribution. As a result, departure from universality of the total DM annihilation signal (the one which we have access to) is expected.
This is illustrated using all MCXC galaxy clusters. Defining for any cluster its virial
angle
αvir = tan-1(Rvir/d)
and its scale angle
αs = tan-1(rs/d)
(d its distance to the observer), we show in Fig. 1 the fraction of the integrated signal with respect to the maximal
signal obtained, i.e.  (6)as
a function of
η = αint/αs.
(6)as
a function of
η = αint/αs.
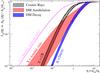 |
Fig. 1 Signal fraction fX(η) (for process X) as function of the reduced integration angle η ≡ αint/αs. For the sake of presentation, only the envelopes for the 1743 clusters of the catalogue are shown. For annihilation, the signal for the smooth only is also shown (the substructure contribution only is similar to the decay case). |
For DM annihilation, the smooth contribution (left-hand envelope) is the most centrally
concentrated as it comes from the integration of the steep DM profile squared
( ).
).
For the decay signal (right-hand envelope), the external parts of the halo contribute
more significantly to the signal because the quantity to integrate is shallower
( ).
We note that in the MCXC catalogue, the mass ratio of the most massive galaxy cluster to
the least massive one is ~100, so that these clusters have different concentrations
Rvir/rs,
hence a different rescaled angular size
αvir/αs. It
does not impact on the DM annihilation signal from the smooth halo (because this signal is
strongly centrally concentrated), but it leads to a small spread for a decay-like signal.
We checked that using an Einasto profile (Springel et al.
2008) instead of a NFW for the DM halos does not change the curves significantly.
).
We note that in the MCXC catalogue, the mass ratio of the most massive galaxy cluster to
the least massive one is ~100, so that these clusters have different concentrations
Rvir/rs,
hence a different rescaled angular size
αvir/αs. It
does not impact on the DM annihilation signal from the smooth halo (because this signal is
strongly centrally concentrated), but it leads to a small spread for a decay-like signal.
We checked that using an Einasto profile (Springel et al.
2008) instead of a NFW for the DM halos does not change the curves significantly.
For CRs (black envelope), the trend is similar to the decay case because
 .
The shift between the CRs and decay envelopes comes from the gas being more centrally
concentrated than DM.
.
The shift between the CRs and decay envelopes comes from the gas being more centrally
concentrated than DM.
The DM annihilation from substructures is directly proportional to the integration of the substructure spatial distribution dNsubs/dV, which we have chosen in this work to follow the smooth DM profile. Because of this choice, the signal from substructures follows the same dependence as DM decay and is therefore not repeated in the figure. Similar to the smooth annihilation signal, changing this distribution does not impact on the conclusions significantly. As underlined, the more complex (i.e. non-universal) scaling of the total annihilation signal shown in Fig. 1 comes from the fact that both the smooth halo and the substructures contribute to the signal. As shown in Fig. 4 of Nezri et al. (2012), the distribution of boosts for the MCXC sample depends on the substructure configuration, and it can vary from 1 (no boost) to about 100 for a Phoenix-like configuration. In the former case, the angular dependence would be close to the smooth only annihilation case, whereas for the latter case, it would show a decay-like angular dependence.
To conclude, whereas the angular dependence is sometimes argued to be a good diagnosis to disentangle a CR signal from a DM signal, we draw attention to the fact that the situation is not that clear cut for galaxy clusters. Indeed, a CR signal is more centrally concentrated than a DM decay signal. However, for the annihilation case, it could be more concentrated than the CR signal, close to the DM decay case, or in-between.
3.2. Number of objects per flux bin
We now turn to the behaviour of the number of objects found given their flux, i.e. the
log N − log F dependence, where
 is the actual observed flux (it is referred to as the
 dependence below). Let us define the relative flux
  of the ith galaxy cluster, i.e. the flux relative to that of the
brightest object of the catalogue for the process X at stake:
of the ith galaxy cluster, i.e. the flux relative to that of the
brightest object of the catalogue for the process X at stake:
 (7)Such a definition allows
us to visually compare the behaviour for the different X processes.
(7)Such a definition allows
us to visually compare the behaviour for the different X processes.
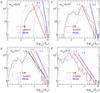 |
Fig. 2 Number of galaxy clusters per logarithmic bin of
|

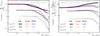 |
Fig. 3 Cumulative of the signal above a threshold value
|

This is shown in Fig. 2, where the number of objects
N per logarithmic bin (of  )
is plotted for the MCXC sample. At first glance, the value of the slope s
(
)
is plotted for the MCXC sample. At first glance, the value of the slope s
( ) in
the region beyond the distribution peak can be used as a diagnosis of the signal
origin6. We observe that the behaviour of the DM
annihilation and CR components is very similar. This is tentatively explained by the fact
that the CR emissivity Eq. (4) is
) in
the region beyond the distribution peak can be used as a diagnosis of the signal
origin6. We observe that the behaviour of the DM
annihilation and CR components is very similar. This is tentatively explained by the fact
that the CR emissivity Eq. (4) is
 and DM annihilation is
 . For the
latter, the slope sannihil. varies in the
range
[sdecay/2,sdecay] :
for small integration angles (top left),
ℰdecay ∝ ρDM and
. For the
latter, the slope sannihil. varies in the
range
[sdecay/2,sdecay] :
for small integration angles (top left),
ℰdecay ∝ ρDM and
 and
sannihil. ≈ sdecay/2
(substructures scarcely play a role in the central regions of the cluster), whereas for
integration angles encompassing the whole cluster (bottom right), the substructure
contribution becomes dominant and
sannihil. ≈ sdecay.
Actually, the annihilation signal at any given integration angle is sensitive to the DM
substructure configuration (as explained in the previous section, see also Sect. 3.4 of
Nezri et al. 2012), so that the values of
sannihil. shown in Fig. 2 are very uncertain (they are bracketed by the value
obtained for the CR case and the value for the decay case).
and
sannihil. ≈ sdecay/2
(substructures scarcely play a role in the central regions of the cluster), whereas for
integration angles encompassing the whole cluster (bottom right), the substructure
contribution becomes dominant and
sannihil. ≈ sdecay.
Actually, the annihilation signal at any given integration angle is sensitive to the DM
substructure configuration (as explained in the previous section, see also Sect. 3.4 of
Nezri et al. 2012), so that the values of
sannihil. shown in Fig. 2 are very uncertain (they are bracketed by the value
obtained for the CR case and the value for the decay case).
The actual value of s is difficult to explain from simple arguments because it comes from the interplay of the profile, normalisation, and integration angle for each cluster. This analysis nevertheless shows that a CR origin can be disentangled from a DM origin in the case of a decaying DM candidate.
3.3. Stacked signal
As deduced from Fig. 3, the ratio between the
brightest and next-to-brightest clusters could also be an indicator of the
γ-ray signal origin (it is the largest for CR origin and the lowest for
decay at 0.5°, bottom right-hand panel). This is, however, sensitive to the
individual modelling of the clusters, especially for the annihilation case because of the
extra uncertainty from DM substructures. In that respect, this ratio criterion (or also
using the ratio of the CR signal to the DM annihilation signal, see Pinzke et al. 2011) should be used with caution. The cumulative7 of the signal also suffers from similar uncertainties.
However, as the number of stacked objects increases, the sensitivity to the modelling of a
given halo becomes less crucial. The possibility to identify the origin X
of a signal from the behaviour of the stacked signal is very similar in spirit to
comparing the slope s of the  relation. However, if the signal is only seen by means of stacking, it may not be possible
to get s, but still possible to say something about the origin from this
detection.
relation. However, if the signal is only seen by means of stacking, it may not be possible
to get s, but still possible to say something about the origin from this
detection.
The promise of a stacking analysis for a signal X depends on the slope
s of the
relation. If the number of objects increases faster than the signal decreases, a better
sensitivity should be reached compared to the single-source analysis case. This was shown
to be the case for decay in Combet et al. (2012),
but not for annihilation (Nezri et al. 2012). A
detailed discussion of detectability in the light of the Fermi-LAT and
CTA-like instruments was also presented in that paper. Here, we extend the analysis to the
CR case, and comment on the differences between the various signals. The simple approach
used in Combet et al. (2012) is enough to capture
the trends and draw some conclusions, i.e. we consider the generic extreme case of a
signal- and a background-limited observation8.
As in the previous section, we work with the normalised
flux
defined by Eq. (7) to ease the comparison
between the different X origins. The cumulative for a signal-limited
observation (left-hand panel) corresponds to 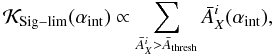 (8)while that for a
background-limited observation is
(8)while that for a
background-limited observation is 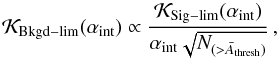 (9)where
 is
the number of clusters satisfying
is
the number of clusters satisfying 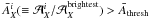 . This is
shown in Fig. 3 for the MCXC catalogue9. For display purposes, the curves for various
processes X are normalised to the asymptotic value (when all objects are
stacked), whereas the curves for different integration angles
αint are shifted from one another.
. This is
shown in Fig. 3 for the MCXC catalogue9. For display purposes, the curves for various
processes X are normalised to the asymptotic value (when all objects are
stacked), whereas the curves for different integration angles
αint are shifted from one another.
Regardless of the integration angle and whether the regime is signal or background limited, stacking leads to a significantly larger increase of the signal for DM decay than for the CR case. Indeed, as shown in Combet et al. (2012) for the DM decay component, improvement with respect to the brightest source can reach at best (with the MCXC catalogue) a factor of ~100 for background-free instruments, but a factor ~5 is expected for more realistic background-limited instruments. For both the CR and DM annihilation component, the improvement is respectively ~50 (background free) and ~2 (background limited) for αint ≲ 0.1°. A detailed analysis based on a realistic instrumental response for the Fermi-LAT and CTA instruments shows that this factor of two (for annihilation) is only achieved for Fermi-LAT, there is no improvement with CTA-like instruments (Nezri et al. 2012). Hence a similar result is expected for the CR-induced origin. Although in principle the behaviour of stacked signals at different angles for the DM annihilation case can be disentangled from the two other cases for the signal-limited regime, the uncertainties on the substructure distribution are such that the spread generated on the stacked annihilation signal is encompassed by the CR and DM decay case and thus cannot be distinguished for now.
4. Conclusion
The first two papers of this series investigated the potential benefit of a stacking analysis of clusters of galaxies for DM detection. Relying on the largest uniformed X-ray catalogue to date, the MCXC catalogue (Piffaretti et al. 2011), it was shown that a DM decay signal benefits from a stacking analysis (Combet et al. 2012), but that the situation is less promising for the annihilation signal (Nezri et al. 2012). In this third and last paper of the series, we extended the analysis to the expected CR-induced component, hoping to put to the forth a difference that may be used as a novel diagnosis to identify the origin of the signal when detection in such objects becomes routinely available.
Based on the slope s of the  behaviour (or equivalently on the benefit gained by stacking the signal from many objects),
we have found that a DM origin can be identified against an astrophysical background in the
case of decaying DM, but not for annihilating DM. Though, in principle, combining the
angular-dependence information and the stacked signal at different integration angles gives
clues as to the signal origin, the existing uncertainties on the DM substructures (which may
contribute significantly to the annihilation signal) prevents us from reaching any clear
conclusion. Furthermore, whereas it has been sometimes argued that the angular dependence
can be used to disentangle DM decay from DM annihilation, we have shown for galaxy clusters
that i) there is not strictly a universal angular dependence for the annihilating signal,
and ii) that the very uncertainties on the DM substructures prevent us from predicting
exactly what this dependence is. Hence, decaying DM is the simplest scenario to test and/or
exclude, because it is the most sensitive to stacking and the angular dependence of several
objects can also be stacked (with a rescaling).
behaviour (or equivalently on the benefit gained by stacking the signal from many objects),
we have found that a DM origin can be identified against an astrophysical background in the
case of decaying DM, but not for annihilating DM. Though, in principle, combining the
angular-dependence information and the stacked signal at different integration angles gives
clues as to the signal origin, the existing uncertainties on the DM substructures (which may
contribute significantly to the annihilation signal) prevents us from reaching any clear
conclusion. Furthermore, whereas it has been sometimes argued that the angular dependence
can be used to disentangle DM decay from DM annihilation, we have shown for galaxy clusters
that i) there is not strictly a universal angular dependence for the annihilating signal,
and ii) that the very uncertainties on the DM substructures prevent us from predicting
exactly what this dependence is. Hence, decaying DM is the simplest scenario to test and/or
exclude, because it is the most sensitive to stacking and the angular dependence of several
objects can also be stacked (with a rescaling).
The robustness of this analysis would benefit from a more thorough investigation that takes into account various sources of uncertainties, such as the DM and gas profile modelling. For instance, the intrinsic scatter observed in gas density profiles at the centre of clusters (due to gas physics, interactions with the central galaxy and with the often present active nucleus, the dynamical state of the cluster, etc.) could affect the CR signal signature. Similarly a more systematic check of the dependence of the DM annihilation signal on the clump parameters (for the substructures’ contribution) is certainly needed. The calculations presented here have been done in the idealised scenario where all clusters have a dominant signal component of the same nature, whether it be DM decay, annihilation or astrophysical. The effect may be even less clear if this is not the case. Nevertheless, this may be a useful test that will complement those already suggested in the literature (spectral feature, spatial-dependence of the signal, multi-wavelength analysis, angular power spectrum).
The redshift distribution of the MCXC catalogue of galaxy clusters (Piffaretti et al. 2011) peaks at z ~ 0.1 (see their Fig. 1). Following Combet et al. (2012) and Nezri et al. (2012), we neglect the absorption for the MCXC galaxy clusters, so that the energy-dependent term and the spatial term are decoupled.
MΔ (with Δ = 200 or 500) is the mass enclosed in a sphere of radius RΔ, the radius within which the average density reaches Δ times the critical density of the Universe.
In practice, we work with virial quantities (see, e.g. Giocoli et al. 2010, to switch from Δ to virial quantities), e.g. Rvir is the physical size of the galaxy cluster halo.
A detailed discussion of the annihilation signal and its dependence on the substructure parameters can be found in Sect. 3.4 of Nezri et al. (2012) and is not repeated here. We underline that taking the same distribution as the smooth halo for this quantity or using that of Gao et al. (2012b) does not impact the annihilation results (see Nezri et al. 2012).
The catalogue is not complete across the range of masses it samples, explaining the peaks seen in Fig. 2 (the selection function is undetermined, beyond the scope of this paper, and not accounted for in the discussion).
The cumulative is defined to be the cumulated flux of all objects brighter than a threshold flux.
The detectability of galaxy clusters depends both on the integrated signal and on the
much higher level of charged particle and diffuse astrophysical γ-ray
backgrounds. In the background-limited regime the best approach is to maximise the
signal-to-noise ratio. For a uniform background, it corresponds to the cumulative of
 divided by the square root of the background which is
 .
.
The plateau reached by the cumulative signal on the left-hand panel is due to the drop of the number of objects seen in Fig. 2.
Acknowledgments
We thank J. Hinton and R. White for useful discussions. We thank the referee for his/her careful reading and comments that helped clarify the paper.
References
- Abdo, A. A., Ackermann, M., Ajello, M., et al. 2009, ApJ, 699, 31 [NASA ADS] [CrossRef] [Google Scholar]
- Ackermann, M., Ajello, M., Allafort, A., et al. 2010, ApJ, 717, L71 [NASA ADS] [CrossRef] [Google Scholar]
- Aharonian, F., Akhperjanian, A. G., Aye, K.-M., et al. 2004, A&A, 425, L13 [NASA ADS] [CrossRef] [EDP Sciences] [Google Scholar]
- Aharonian, F., Akhperjanian, A. G., Anton, G., et al. 2009a, A&A, 495, 27 [NASA ADS] [CrossRef] [EDP Sciences] [Google Scholar]
- Aharonian, F., Akhperjanian, A. G., Anton, G., et al. 2009b, A&A, 502, 437 [NASA ADS] [CrossRef] [EDP Sciences] [Google Scholar]
- Aleksić, J., Antonelli, L. A., Antoranz, P., et al. 2010, ApJ, 710, 634 [NASA ADS] [CrossRef] [Google Scholar]
- Aleksić, J., Alvarez, E. A., Antonelli, L. A., et al. 2012, A&A, 539, L2 [NASA ADS] [CrossRef] [EDP Sciences] [Google Scholar]
- Ando, S., & Komatsu, E. 2006, Phys. Rev. D, 73, 023521 [NASA ADS] [CrossRef] [Google Scholar]
- Ando, S., & Nagai, D. 2012, J. Cosmol. Astropart. Phys., 7, 17 [NASA ADS] [CrossRef] [Google Scholar]
- Arnaud, M., Pratt, G. W., Piffaretti, R., et al. 2010, A&A, 517, A92 [NASA ADS] [CrossRef] [EDP Sciences] [Google Scholar]
- Bode, P., Ostriker, J. P., & Vikhlinin, A. 2009, ApJ, 700, 989 [NASA ADS] [CrossRef] [Google Scholar]
- Bringmann, T., Calore, F., Vertongen, G., & Weniger, C. 2011, Phys. Rev. D, 84, 103525 [NASA ADS] [CrossRef] [Google Scholar]
- Bullock, J. S., Kolatt, T. S., Sigad, Y., et al. 2001, MNRAS, 321, 559 [Google Scholar]
- Buote, D. A., Gastaldello, F., Humphrey, P. J., et al. 2007, ApJ, 664, 123 [NASA ADS] [CrossRef] [Google Scholar]
- Capelo, P. R., Coppi, P. S., & Natarajan, P. 2012, MNRAS, 422, 686 [NASA ADS] [CrossRef] [Google Scholar]
- Charbonnier, A., Combet, C., & Maurin, D. 2012, Comput. Phys. Commun., 183, 656 [NASA ADS] [CrossRef] [Google Scholar]
- Colafrancesco, S., Profumo, S., & Ullio, P. 2006, A&A, 455, 21 [NASA ADS] [CrossRef] [EDP Sciences] [Google Scholar]
- Colafrancesco, S., Marchegiani, P., & Giommi, P. 2010, A&A, 519, A82 [Google Scholar]
- Combet, C., Maurin, D., Nezri, E., et al. 2012, Phys. Rev. D, 85, 063517 [NASA ADS] [CrossRef] [Google Scholar]
- Croston, J. H., Pratt, G. W., Böhringer, H., et al. 2008, A&A, 487, 431 [NASA ADS] [CrossRef] [EDP Sciences] [Google Scholar]
- Duffy, A. R., Schaye, J., Kay, S. T., & Dal la Vecchia, C. 2008, MNRAS, 390, L64 [NASA ADS] [CrossRef] [Google Scholar]
- Duffy, A. R., Schaye, J., Kay, S. T., et al. 2010, MNRAS, 405, 2161 [NASA ADS] [Google Scholar]
- Enßlin, T., Pfrommer, C., Miniati, F., & Subramanian, K. 2011, A&A, 527, A99 [NASA ADS] [CrossRef] [EDP Sciences] [Google Scholar]
- Ettori, S., Morandi, A., Tozzi, P., et al. 2009, A&A, 501, 61 [NASA ADS] [CrossRef] [EDP Sciences] [Google Scholar]
- Ettori, S., Gastaldello, F., Leccardi, A., et al. 2010, A&A, 524, A68 [NASA ADS] [CrossRef] [EDP Sciences] [Google Scholar]
- Frederiksen, T. F., Hansen, S. H., Host, O., & Roncadelli, M. 2009, ApJ, 700, 1603 [NASA ADS] [CrossRef] [Google Scholar]
- Gao, L., Navarro, J. F., Cole, S., et al. 2008, MNRAS, 387, 536 [NASA ADS] [CrossRef] [Google Scholar]
- Gao, L., Frenk, C. S., Boylan-Kolchin, M., et al. 2011, MNRAS, 410, 2309 [NASA ADS] [CrossRef] [Google Scholar]
- Gao, L., Frenk, C. S., Jenkins, A., Springel, V., & White, S. D. M. 2012a, MNRAS, 419, 1721 [NASA ADS] [CrossRef] [Google Scholar]
- Gao, L., Navarro, J. F., Frenk, C. S., Jenkins, A., Springel, V., & White, S. D. M. 2012b, MNRAS, 425, 2169 [NASA ADS] [CrossRef] [Google Scholar]
- Giocoli, C., Tormen, G., Sheth, R. K., & van den Bosch, F. C. 2010, MNRAS, 404, 502 [NASA ADS] [Google Scholar]
- Han, J., Frenk, C. S., Eke, V. R., Gao, L., & White, S. D. M. 2012 [arXiv:1201.1003] [Google Scholar]
- Huang, X., Vertongen, G., & Weniger, C. 2012, J. Cosmol. Astropart. Phys., 1, 42 [NASA ADS] [CrossRef] [Google Scholar]
- Jeltema, T. E., & Profumo, S. 2011, ApJ, 728, 53 [NASA ADS] [CrossRef] [Google Scholar]
- Jeltema, T. E., Kehayias, J., & Profumo, S. 2009, Phys. Rev. D, 80, 023005 [NASA ADS] [CrossRef] [Google Scholar]
- Kiuchi, R., Mori, M., Bicknell, G. V., et al. 2009, ApJ, 704, 240 [NASA ADS] [CrossRef] [Google Scholar]
- Klypin, A. A., Trujillo-Gomez, S., & Primack, J. 2011, ApJ, 740, 102 [Google Scholar]
- Komatsu, E., & Seljak, U. 2001, MNRAS, 327, 1353 [NASA ADS] [CrossRef] [Google Scholar]
- Macciò, A. V., Dutton, A. A., & van den Bosch, F. C. 2008, MNRAS, 391, 1940 [NASA ADS] [CrossRef] [Google Scholar]
- Makino, N., Sasaki, S., & Suto, Y. 1998, ApJ, 497, 555 [NASA ADS] [CrossRef] [Google Scholar]
- Muñoz-Cuartas, J. C., Macciò, A. V., Gottlöber, S., & Dutton, A. A. 2011, MNRAS, 411, 584 [NASA ADS] [CrossRef] [Google Scholar]
- Navarro, J. F., Frenk, C. S., & White, S. D. 1997, ApJ, 490, 493 [NASA ADS] [CrossRef] [Google Scholar]
- Neto, A. F., Gao, L., Bett, P., et al. 2007, MNRAS, 381, 1450 [NASA ADS] [CrossRef] [Google Scholar]
- Nezri, E., White, R., Combet, C., et al. 2012, MNRAS, 425, 477 [NASA ADS] [CrossRef] [Google Scholar]
- Ostriker, J. P., Bode, P., & Babul, A. 2005, ApJ, 634, 964 [NASA ADS] [CrossRef] [Google Scholar]
- Palomares-Ruiz, S., & Siegal-Gaskins, J. M. 2010, J. Cosmol. Astropart. Phys., 7, 23 [NASA ADS] [CrossRef] [Google Scholar]
- Pato, M., Pieri, L., & Bertone, G. 2009, Phys. Rev. D, 80, 103510 [NASA ADS] [CrossRef] [Google Scholar]
- Perkins, J. S., Badran, H. M., Blaylock, G., et al. 2006, ApJ, 644, 148 [Google Scholar]
- Piffaretti, R., Arnaud, M., Pratt, G. W., Pointecouteau, E., & Melin, J.-B. 2011, A&A, 534, A109 [NASA ADS] [CrossRef] [EDP Sciences] [Google Scholar]
- Pinzke, A., & Pfrommer, C. 2010, MNRAS, 409, 449 [NASA ADS] [CrossRef] [Google Scholar]
- Pinzke, A., Pfrommer, C., & Bergström, L. 2011, Phys. Rev. D, 84, 123509 [NASA ADS] [CrossRef] [Google Scholar]
- Pointecouteau, E., Arnaud, M., & Pratt, G. W. 2005, A&A, 435, 1 [NASA ADS] [CrossRef] [EDP Sciences] [Google Scholar]
- Pratt, G. W., & Arnaud, M. 2002, A&A, 394, 375 [NASA ADS] [CrossRef] [EDP Sciences] [Google Scholar]
- Pratt, G. W., Croston, J. H., Arnaud, M., & Böhringer, H. 2009, A&A, 498, 361 [NASA ADS] [CrossRef] [EDP Sciences] [Google Scholar]
- Pratt, G. W., Arnaud, M., Piffaretti, R., et al. 2010, A&A, 511, A85 [NASA ADS] [CrossRef] [EDP Sciences] [Google Scholar]
- Regis, M., & Ullio, P. 2008, Phys. Rev. D, 78, 043505 [NASA ADS] [CrossRef] [Google Scholar]
- Springel, V., Wang, J., Vogelsberger, M., et al. 2008, MNRAS, 391, 1685 [NASA ADS] [CrossRef] [Google Scholar]
- Suto, Y., Sasaki, S., & Makino, N. 1998, ApJ, 509, 544 [NASA ADS] [CrossRef] [Google Scholar]
- Vikhlinin, A., Kravtsov, A., Forman, W., et al. 2006, ApJ, 640, 691 [NASA ADS] [CrossRef] [Google Scholar]
- Walker, M. G., Combet, C., Hinton, J. A., Maurin, D., & Wilkinson, M. I. 2011, ApJ, 733, L46 [NASA ADS] [CrossRef] [Google Scholar]
- Wechsler, R. H., Bullock, J. S., Primack, J. R., Kravtsov, A. V., & Dekel, A. 2002, ApJ, 568, 52 [NASA ADS] [CrossRef] [Google Scholar]
- Wechsler, R. H., Zentner, A. R., Bullock, J. S., Kravtsov, A. V., & Allgood, B. 2006, ApJ, 652, 71 [NASA ADS] [CrossRef] [Google Scholar]
- Zhao, D. H., Jing, Y. P., Mo, H. J., & Börner, G. 2003, ApJ, 597, L9 [NASA ADS] [CrossRef] [Google Scholar]
- Zhao, D. H., Jing, Y. P., Mo, H. J., & Börner, G. 2009, ApJ, 707, 354 [NASA ADS] [CrossRef] [Google Scholar]
All Figures
|
Fig. 1 Signal fraction fX(η) (for process X) as function of the reduced integration angle η ≡ αint/αs. For the sake of presentation, only the envelopes for the 1743 clusters of the catalogue are shown. For annihilation, the signal for the smooth only is also shown (the substructure contribution only is similar to the decay case). |
| In the text | |
|
Fig. 2 Number of galaxy clusters per logarithmic bin of
|
| In the text | |
|
Fig. 3 Cumulative of the signal above a threshold value
|
| In the text | |
Current usage metrics show cumulative count of Article Views (full-text article views including HTML views, PDF and ePub downloads, according to the available data) and Abstracts Views on Vision4Press platform.
Data correspond to usage on the plateform after 2015. The current usage metrics is available 48-96 hours after online publication and is updated daily on week days.
Initial download of the metrics may take a while.