Fig. 1
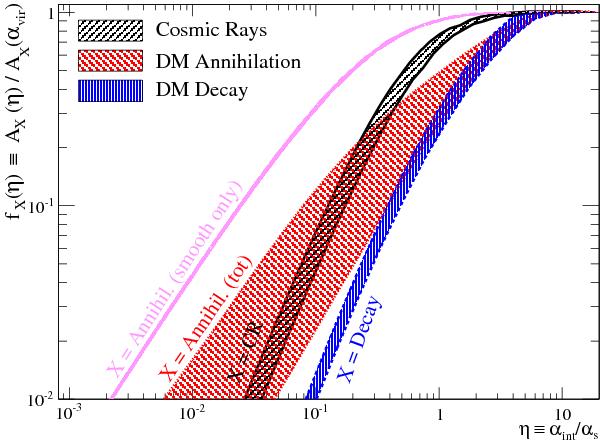
Signal fraction fX(η) (for process X) as function of the reduced integration angle η ≡ αint/αs. For the sake of presentation, only the envelopes for the 1743 clusters of the catalogue are shown. For annihilation, the signal for the smooth only is also shown (the substructure contribution only is similar to the decay case).
Current usage metrics show cumulative count of Article Views (full-text article views including HTML views, PDF and ePub downloads, according to the available data) and Abstracts Views on Vision4Press platform.
Data correspond to usage on the plateform after 2015. The current usage metrics is available 48-96 hours after online publication and is updated daily on week days.
Initial download of the metrics may take a while.