Fig. 3
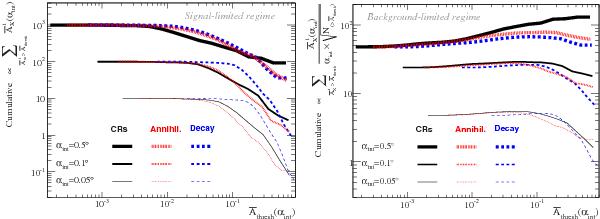
Cumulative of the signal above a threshold value
 for the signal-limited regime (left panel, corresponding to
Eq. (8)) and for the
background-limited regime (right panel, corresponding to Eq. (9)). The three line widths correspond to
three integration angles, and the three styles and colours correspond to CRs, DM
annihilation, and decay. An arbitrary normalisation is set in order to ease the
comparison by eye of the different signals.
for the signal-limited regime (left panel, corresponding to
Eq. (8)) and for the
background-limited regime (right panel, corresponding to Eq. (9)). The three line widths correspond to
three integration angles, and the three styles and colours correspond to CRs, DM
annihilation, and decay. An arbitrary normalisation is set in order to ease the
comparison by eye of the different signals.
Current usage metrics show cumulative count of Article Views (full-text article views including HTML views, PDF and ePub downloads, according to the available data) and Abstracts Views on Vision4Press platform.
Data correspond to usage on the plateform after 2015. The current usage metrics is available 48-96 hours after online publication and is updated daily on week days.
Initial download of the metrics may take a while.