| Issue |
A&A
Volume 537, January 2012
|
|
|---|---|---|
| Article Number | A143 | |
| Number of page(s) | 16 | |
| Section | Extragalactic astronomy | |
| DOI | https://doi.org/10.1051/0004-6361/201117680 | |
| Published online | 24 January 2012 | |
Ram pressure stripping of the multiphase ISM and star formation in the Virgo spiral galaxy NGC 4330
1 CDS, Observatoire astronomique de Strasbourg, UMR 7550, 11 rue de l’université, 67000 Strasbourg, France
e-mail: Bernd.Vollmer@astro.unistra.fr
2 Astronomical Observatory, Jagiellonian University, Kraków, Poland
3 Laboratoire d’Astrophysique de Bordeaux, Université de Bordeaux, OASU, CNRS/INSU, 33271 Floirac, France
4 Yale University Astronomy Department, PO Box 208101, New Haven, CT 06520-8101, USA
5 Max-Planck-Insitut für Radioastronomie, Auf dem Hügel 69, 53121 Bonn, Germany
6 Department of Astronomy and Space Science, Yonsei University, Republic of Korea
7 Department of Astronomy, Columbia University, 538 West 120th Street, New York, NY 10027, USA
Received: 11 July 2011
Accepted: 11 November 2011
It has been shown that the Virgo spiral galaxy NGC 4330 shows signs of ongoing ram pressure stripping at multiple wavelengths. At the leading edge of the interaction, the Hα and dust extinction curve sharply out of the disk. On the trailing side, a long Hα/UV tail has been found which is located upwind of a long Hi tail. We complement the multiwavelength study with IRAM 30m HERA CO(2–1) and VLA 6 cm radio continuum observations of NGC 4330. The data are interpreted with the help of a dynamical model including ram pressure and, for the first time, star formation. Our best-fit model qualitatively reproduces the observed projected position, the radial velocity of the galaxy, the molecular and atomic gas distribution and velocity field, and the UV distribution in the region where a gas tail is present. However, the observed red UV color on the windward side is currently not reproduced by the model. On the basis of our model, the galaxy moves to the north and still approaches the cluster center with the closest approach occurring in ~100 Myr. In contrast to other Virgo spiral galaxies affected by ram pressure stripping, NGC 4330 does not show an asymmetric ridge of polarized radio continuum emission. We suggest that this is due to the relatively slow compression of the ISM and the particular projection of NGC 4330. The observed offset between the Hi and UV tails is well-reproduced by our model. Since collapsing and starforming gas clouds decouple from the ram pressure wind, the UV-emitting young stars have the angular momentum of the gas at the time of their creation. On the other hand, the gas is constantly pushed by ram pressure. We provide stellar age distributions within three radial bins in the galactic disk (R > 5 kpc). Deep optical spectra could be used to test the quenching times suggested by our analysis. The reaction (phase change, star formation) of the multiphase ISM (molecular, atomic, ionized) to ram pressure is discussed in the framework of our dynamical model.
Key words: galaxies: kinematics and dynamics / galaxies: ISM / galaxies: interactions / galaxies: individual: NGC 4330
© ESO, 2012
1. Introduction
The environment has a strong influence on spiral galaxies evolving in a cluster. The ideal place to study the evolution of cluster spiral galaxies is the Virgo cluster, because it represents the only cluster in the northern hemisphere where one can observe the ISM distribution and kinematics of cluster galaxies at a kpc resolution (1 kpc ~ 12″)1. The Virgo cluster is dynamically young and spiral-rich. The cluster spiral galaxies have lost up to 90% of their neutral hydrogen, i.e. they are Hi deficient (Chamaraux et al. 1980; Giovanelli & Haynes 1983). Imaging Hi observations have shown that these galaxies have truncated Hi disks (Giovanelli & Haynes 1983; Cayatte et al. 1990). Thus, the cluster environment changes the Hi content and morphology of Virgo cluster spiral galaxies. However, Virgo spiral galaxies are not or only mildly CO-deficient (Kenney & Young 1989; see, however, Fumagalli et al. 2009). In their Hi imaging survey of Virgo galaxies (VIVA: VLA Imaging of Virgo galaxies in Atomic gas, Chung et al. 2009), Chung et al. (2007) found seven spiral galaxies with long one-sided Hi tails. These galaxies were found in intermediate- to low-density regions (0.6–1 Mpc in projection from M 87). The tails all point roughly away from M 87, suggesting that these tails are caused by ram pressure stripping. Therefore, ram pressure stripping can affect spiral galaxies at radial distances as great as the cluster virial radius. The further evolution of a galaxy depends critically on its orbit (see, e.g., Vollmer et al. 2001), i.e. a highly eccentric orbit will lead the galaxy at a large velocity into the cluster core, where the intracluster medium is at its densest and ram pressure will be very strong.
NGC 4330 is one of the Virgo spiral galaxies with a long Hi tail observed by Chung et al. (2007). It has a maximum rotation velocity of vrot ~ 180 km s-1 and a total Hi mass of MHI = 4.5 × 10⁸ M⊙ (Chung et al. 2009). It is located at a projected distance of ~2° (600 kpc) from the cluster center, i.e. it is relatively close to M 87, and has a radial velocity of 400 km s-1 with respect to the Virgo mean velocity. The Hi deficiency of NGC 4330 is 0.8 (Chung et al. 2007). The Hi distribution in the galactic disk is truncated at about half the optical radius. In addition, NGC 4330 is one of the rare Virgo galaxies showing an extended UV tail (Abramson et al. 2011). The Hi and UV tails have a significant offset, with the Hi tail being downwind of the UV tail. At the leading edge of the interaction, the Hα emission and dust extinction distribution is bent sharply out of the galactic disk. These features are signs of active ram pressure stripping. For a comprehensive description of NGC 4330’s optical, UV, and Hi data, we refer to Abramson et al. (2011). These authors suggest a scenario in which NGC 4330 is falling into the cluster center for the first time and has experienced a significant increase in ram pressure over the past 200–400 Myr.
In the ram pressure stripping time sequence of Virgo cluster galaxies, Vollmer (2009) classified NGC 4330 as a case of pre-peak ram pressure stripping together with NGC 4501. This evolutionary stage is consistent with a galaxy orbit leading the galaxy to its closest approach (620 kpc) of the cluster center (M 87) in ~100 Myr.
In this article, we present new CO and 6 cm radio continuum observations of NGC 4330, describe in detail the numerical simulations, and provide an explanation of the observed offset between the Hi and UV tails, which is due to the decoupling of dense collapsing gas clouds from the ram pressure wind. The article is structured in the following way: the dynamical model is described in Sect. 2 and the best-fit model is presented in Sect. 3. The CO(2–1) and 6 cm radio continuum observations are presented in Sects. 6 and 7. The distribution of the polarized radio continuum emission is compared to MHD simulations in Sect. 7.3. The peculiar Hα and UV emission distributions of NGC 4330 are compared to the model in Sects. 8 and 9, followed by the overall picture of the ram pressure stripping event (Sect. 10). The stellar age distributions of the gas-free parts of the galactic disk are presented in Sect. 11. Finally, we present our conclusions in Sect. 12.
2. Dynamical model
We used the N-body code described in Vollmer et al. (2001), which consists of two components: a non-collisional component that simulates the stellar bulge/disk and the dark halo, and a collisional component that simulates the ISM. A new scheme for star formation was implemented, where stars were formed during cloud collisions and then evolved as non-collisional particles.
2.1. Halo, stars, and gas
The non-collisional component consists of 81 920 particles, which simulate the galactic halo, bulge, and disk. The characteristics of the different galactic components are shown in Table 1.
Total mass, number of particles N, particle mass M, and smoothing length l for the different galactic components.
The resulting rotation velocity is ~180 km s-1 and the rotation curve becomes flat at a radius of about 5 kpc.
We adopted a model where the ISM is simulated as a collisional component, i.e. as discrete particles that possess a mass and a radius and can have inelastic collisions (sticky particles). Since the ISM is a turbulent and fractal medium (see e.g. Elmegreen & Falgarone 1996), it is neither continuous nor discrete. The volume filling factor of the warm and cold phases is smaller than one. The warm neutral and ionized gas fill about 30 − 50% of the volume, whereas cold neutral gas has a volume filling factor smaller than 10% (Boulares & Cox 1990). It is unclear how this fraction changes, when an external pressure is applied. In contrast to smoothed particle hydrodynamics (SPH), which is a quasi-continuous approach where the particles cannot penetrate each other, our approach allows a finite penetration length, which is given by the mass-radius relation of the particles. Both methods have their advantages and their limits. The advantage of our approach is that ram pressure can be easily included as an additional acceleration on particles that are not protected by other particles (see Vollmer et al. 2001).
The 20 000 particles of the collisional component represent gas cloud complexes that evolve in the gravitational potential of the galaxy. The total assumed gas mass is  M⊙, which corresponds to the total neutral gas mass before stripping, i.e. to an Hi deficiency of 0, which is defined as the logarithm of the ratio of the Hi content of a field galaxy of same morphological type and diameter to the observed Hi mass. To each particle, a radius is attributed depending on its mass. During the disk evolution, the particles can have inelastic collisions, the outcome of which (coalescence, mass exchange, or fragmentation) is simplified following Wiegel (1994). This results in an effective gas viscosity in the disk.
As the galaxy moves through the ICM, its clouds are accelerated by ram pressure. Within the galaxy’s inertial system, its clouds are exposed to a wind coming from a direction opposite to that of the galaxy’s motion through the ICM. The temporal ram pressure profile has the form of a Lorentzian, which is realistic for galaxies on highly eccentric orbits within the Virgo cluster (Vollmer et al. 2001). The effect of ram pressure on the clouds is simulated by an additional force on the clouds in the wind direction. Only clouds that are not protected by other clouds against the wind are affected. Since the gas cannot develop instabilities, the influence of turbulence on the stripped gas is not included in the model. The mixing of the intracluster medium into the ISM is very crudely approximated by a finite penetration length of the intracluster medium into the ISM, i.e. up to this penetration length the clouds undergo an additional acceleration caused by ram pressure.
The particle trajectories are integrated using an adaptive timestep for each particle. This method is described in Springel et al. (2001). The following criterion for an individual timestep is applied:  (1)where ai is the acceleration of the particle i. The minimum value of ti defines the global timestep used for the Burlisch-Stoer integrator that integrates the collisional component, and is typically a few 104 yr.
2.2. Star formation
We assume that the star formation rate is proportional to the cloud collision rate. During the simulations, stars are formed in cloud-cloud collisions. At each collision, a collisionless particle is created, which is added to the ensemble of collisional and collisionless particles. The newly created collisionless particles have zero mass (they are test particles) and the positions and velocities of the colliding clouds after the collision. These particles are then evolved passively with the whole system. Since in our sticky-particle scheme there is mass exchange, coalescence, or fragmentation at the end of a collision, the same clouds do not collide infinitely. The local collision rate traces the cloud density and the velocity dispersion of the collisional component. Since the cloud density increases rapidly with decreasing galactic radius, the number of newly created particles rises steeply toward the galaxy center. To limit the total number of these particles without losing information in the region of interest, we limit the creation of collisionless star particles to galactocentric radii larger than 3.5 kpc. This is substantially smaller than the gas stripping radius at the timestep of interest, which is ~5 kpc.
The information about the time of creation is attached to each newly created star particle. In this way, the Hα emission distribution can be modeled by the distribution of star particles with ages younger than 10 Myr. The UV emission of a star particle in the two GALEX bands is modeled by the UV flux from single stellar population models from STARBURST99 (Leitherer et al. 1999). The total UV distribution is then the extinction-free distribution of the UV emission of the newly created star particles. For the unperturbed galaxy, the resulting power-law between star formation based on the model UV emission and the total/molecular gas surface density (see Sect. 6.2) has an exponent of 1.7/1.2, respectively (Fig. A.1). This is close to the observational findings of Bigiel et al. (2008). The simulations start 600 Myr before peak ram pressure.
3. Search for the best-fit model
We constrain the parameters of the ram pressure stripping event, which are (i) the peak ram pressure; (ii) the temporal ram pressure profile, (iii) time since peak ram pressure; (iv) the inclination angle between the galaxy’s disk and the intracluster medium wind direction; and (v) the azimuthal viewing angle for the observed inclination and position angles. These parameters are related to the observed quantities, which are (1) the position angle; (2) the inclination angle of the galactic disk; (3) the line-of-sight velocity of the galaxy with respect to the cluster mean; and (4) the projected ICM wind direction. The position angle and inclination of NGC 4330 define a plane in three-dimensional (3D) space. The model galaxy can then be rotated within this plane by the azimuthal viewing angle (see below). The 3D model wind direction, the line-of-sight velocity of the galaxy, and the projected ICM wind direction are thus functions of the azimuthal viewing angle.
In the case of a smooth static ICM, ram pressure is proportional to the ICM density ρICM and the square of the galaxy velocity with respect to the Virgo cluster vgal. If the ICM moves with respect to the cluster mean velocity, the expression for ram pressure yields  (2)where vICM is the velocity of the intracluster medium, and vgal is the galaxy velocity with respect to the Virgo cluster. We assume a classical static intracluster medium, i.e. vICM = 0 km s-1 and temporal ram pressure profile of the form
  (3)where tHW is the width of the profile (Vollmer et al. 2001).
We only consider model snapshots leading to a gas truncation radius of about half the optical radius as it is observed. We set pmax = 5000 cm-3 (km s-1)2 and tHW = 100 Myr. We define t = 0 Myr as the time when ram pressure reaches its maximum.
The ram pressure efficiency also depends on the inclination angle i between the galactic disk and the ICM wind direction (Vollmer et al. 2001). Since the Hi observations indicate that stripping occurs more face-on, we do not consider edge-on stripping. We performed two simulations with two different inclination angles between the galaxy’s disk and the ICM wind direction: (i) i = 60° and (ii) i = 75°. An inclination of i = 0° means that the galactic disk is parallel to the ICM wind direction.
The last open parameter, the azimuthal viewing angle, is chosen in such a way to fit the observed Hi distribution and to reproduce the positive line-of-sight component of the wind direction (the galaxy’s radial velocity with respect to the cluster mean is small).
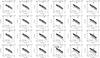 |
Fig. 1 Snapshots of the four ram-pressure stripping simulations. The ram pressure maximum in units of 100 cm-3 (km s-1)2, the duration tHW, and the inclination angle between the orbital and galactic disk plane i are shown on top of each panel. The timestep with respect to the ram pressure maximum are shown in the lower left corner of each panel. The arrow indicates the direction of the ram pressure wind where its size is proportional to the ram pressure strength. The stellar disk is shown in grayscale where lower column densities are darker. The gas is shown as contours. The best-fit model (p = 5000 cm-3 (km s-1)2, t = −100 Myr, i = 75°) is labeled “model”. |
Snapshots of the four simulations are shown in Fig. 1. Inclination angles between the orbital and galactic planes smaller than 75° do not produce a gas tail that bends significantly out of the galactic plane on the lower left side of the galaxy. The gas tail for i = 75° reaches the observed morphology between t = −100 and t = −70 Myr, i.e. 100/70 Myr before peak ram pressure or closest approach to the cluster center. On the basis of the Hi morphology, we chose p = 5000 cm-3 (km s-1)2 and t = −100 Myr as the best-fit model, because these parameters are the most consistent with NGC 4330’s orbit within the Virgo cluster (Vollmer 2009).
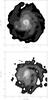 |
Fig. 2 Face-on model Hi distribution. Upper panel: initial condition (t = −600 Myr). Lower panel: best-fit model (t = −100 Myr). The galaxy moves to the left, i.e. the ram pressure wind blows from the left. The low surface density gas at RA < −8 kpc is located at high latitudes, i.e. it is extraplanar. The contour levels are (1,2,4,8,16,32,64) × 10-19 cm-2. |
The model galaxy develops a spiral structure (upper panel of Fig. 2) that influences the gas stripping by means of ram pressure (Schulz & Struck 2001). In a first set of simulations, we used different initial conditions where the spiral arms are in different locations from the present model. By chance, a prominent spiral arm was located at the windward side of the galaxy at the timestep of interest. Owing to its higher column density, a spiral arm is more resistant to ram pressure stripping. The northeastern extraplanar gas thus had a much higher surface density. Since this is not observed, we discarded these first simulations and chose different initial conditions to avoid a spiral arm at the windward side at the timestep of interest ( − 100 Myr). In our best-fit model, the major spiral arms of the outer disk are located on the trailing side (lower panel of Fig. 2).
4. Comparison with H I data
A model cube (right ascension, declination, radial velocity) with the properties of the Hi observations of Chung et al. (2009) is produced from the model gas particle distribution. The observed and model gas distributions and associated position velocity diagrams are shown in Fig. 3. The model gas distribution qualitatively reproduces the main features of the observations: (i) the truncation of the galactic gas disk to the northeast and southwest; (ii) the gas distribution along the minor axis is larger on the shadowed side (southeast); and (iii) the existence of the southwestern tail, especially where there is a model counterpart (a kink) to the discontinuity of the gas distribution between the disk and the tail gas. Despite the overall agreement with observations, there are disagreements. Firstly, the upturn to the southeast is more pronounced in the model than in the observations. In particular, the low column density gas on the eastern side of the galaxy is more extended than the observed gas distribution. Secondly, the structure of the model tail has a pronounced part that is bent by an angle of 18° with respect to the galactic disk, whereas the observed tail bends by an angle of ~30°. Finally, the observed vertical extent of the Hi disk is about twice as large as that of the model gas disk.
The observed gas kinematics along the major axis are well-reproduced by the model, except that the model has an intrinsically steeper rotation curve and a somewhat large rotation velocity. The extensions to high velocities observed in the position velocity diagrams of the gas tail are also present in the model. However, there are differences between the observed and the model position velocity diagrams along the minor axis: (i) the observed position-velocity diagram along the minor axis at the galaxy center and to the northeast have the largest linewidths of ~150 km s-1; (ii) the corresponding model position-velocity diagrams are two times broader; (iii) in the upturn region (northeast) the observed velocities on the windward side are, if they are different, larger than those of the opposite side, whereas the model velocities are smaller. Thus, whereas the model kinematics of the tail region are in qualitative agreement with observations, the model kinematics of the upturn region are different.
5. The role of gas shadowing
The main ingredients of a ram pressure stripping event are (i) ram pressure; (ii) galactic rotation; (iii) gas shadowing, i.e. the finite penetration length of the intracluster medium into the ISM; and (iv) projection.
Our results can be compared to similar ram pressure configurations simulated with an SPH (Schulz & Struck 2001) and 3D hydrodynamical code (Roediger & Brüggen 2006). Projections similar to that of NGC 4330 can be found in both articles. Figure 10 of Schulz & Struck (2001) shows a galaxy stripped at an angle of 40° with respect to the galactic plane. The stripped gas at the windward side has a relatively high column density and is distributed approximately orthogonally to the wind direction. The gas tail of the trailing side also has a relatively high column density and is shifted by an angle of ~10° with respect to the galactic plane. The gas distribution is similar to that of our simulations with (i = 60°, pram = 20, t = −130 to −100 Myr) or (i = 60°, pram = 50, t = −160 to −130 Myr).
The upper left panel of Fig. 5 of Roediger & Brüggen (2006), where the galaxy is stripped at an angle of 60° with respect to the galactic plane, can also be compared to our simulations. The extraplanar gas at the trailing side is aligned with the wind direction, that of the leading side is at an angle of 45°. Whereas the behavior of the leading side is similar to that of our simulations with (i = 75°, pram = 50, t = −130 to −70 Myr), the trailing side of our (and the SPH) model is always much closer to the galactic disk than in the 3D hydrodynamical simulations. The more efficient stripping of the trailing side is caused by Kelvin-Helmholtz instabilities creating turbulent motions and mixing in the extraplanar leeward side, which makes ISM stripping more efficient.
We thus conclude that the angle between the stripped gas at the leeward side of the galaxy and the galactic disk depends on the behavior of the stripped gas involving instabilities and mixing. If the viscosity of the intracluster medium is high, the stripped gas displays less structure and turbulence (Roediger & Brüggen 2008). Observations such as those of NGC 4330 or NGC 4522 (Vollmer et al. 2008) have to constrain the role of instabilities on the stripped gas on the leeward side of the galaxy. In terms of our simple model, the influence of instabilities and mixing is less shadowing or an increase of the penetration length of the intracluster medium. In addition, the gas surface density might decrease. The latter effect is not included in our model. The case of NGC 4522 (Vollmer et al. 2008) demonstrates that gas shadowing is needed.
To investigate the effect of gas shadowing, we redid our “best-fit” simulation without gas shadowing. To recreate the same gas morphology 100 Myr before peak ram pressure, we had to adjust the temporal ram pressure profile: pmax = 2000 cm-3 (km s and tHW = 160 Myr. Thus, in the simulation without gas shadowing a two times smaller ram pressure is needed to obtain the same effect as in the simulation including shadowing. The resulting atomic gas distribution at t = −100 Myr is shown in Fig. 4. The gas distribution is more extended to the south than that of the simulation including gas shadowing. The main difference between the two simulations is the shape of the southwestern gas tail: in the simulation with shadowing, there is (i) a kink between the disk and the tail and (ii) the high surface density part of the tail that is bent by a different angle with respect to the galactic disk. Without shadowing, the gas tail is bent by a constant angle of ~30°, whereas with shadowing this angle is 18°.
The gas kinematics along the minor axis of the two simulations are similar. Since without shadowing all gas clouds are pushed by ram pressure, the velocities along the major axis reach smaller values in the simulations without than with gas shadowing. The position-velocity diagrams along the major axis of the simulations without shadowing reproduce better the observed velocity diagrams than those of the simulations with shadowing.
On the basis of the comparison between the simulations with and without gas shadowing, we suggest that (i) the discontinuity of the observed Hi distribution between the disk and the tail could be due to shadowing and (ii) the effect of shadowing might decrease at the end of the gas tail. In other words, the penetration length of the intracluster medium into the tail ISM increases with increasing distance from the galaxy center. This is expected if turbulent mixing of the intracluster medium into the ISM becomes important (Roediger & Brüggen 2006).
In the following, we only consider the simulations with gas shadowing. The results and conclusions of our study here do not depend on gas shadowing.
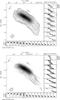 |
Fig. 3 Gas distributions and associated position velocity diagrams. Upper panel: Hi observations (grayscale and contours; Chung et al. 2009). The contour levels of the Hi distribution are (1,2,4,8,16,32,64) × 10-19 cm-2. The beam is shown in the lower left corner. Lower panel: grayscale: observed Hi distribution. Contours: model atomic-gas distribution. The relative contour levels are same as those of the Hi distribution. |
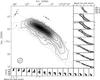 |
Fig. 4 Model without gas shadowing. The relative contour levels are the same as those of the Hi distribution in Fig. 3. |
6. Molecular gas content
6.1. Observations
The observations of the CO(2–1) line, with rest frequency of 230.53799 GHz, were carried out at the 30 m millimeter-wave telescope on Pico Veleta (Spain) run by the Institut de RadioAstronomie Millimétrique (IRAM). The CO(2–1) observations used the HERA multi-beam array, with 3 × 3 dual-polarization receivers, and the WILMA autocorrelator backend with 2MHz spectral resolution. The spatial and spectral resolutions are 11″ and 2.6 km s-1. The HERA observations were made in February and March 2006 and the CO(1–0) in December 2008. In both cases, a nutating secondary (“wobbler”) was used with a throw of 180–200 arcsec in order to be clear of any emission from the galaxy.
Data reduction was straightforward, eliminating any obviously bad channels and excluding the spectra taken under particularly poor conditions (system temperature over 1000 K). Spectra were then summed position by position. System temperatures of the final spectra ranged from 200 K to 500 K on the Ta∗ scale. In Fig. 5, we present the pointings and the map of relative noise of the summed spectra.
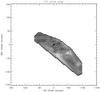 |
Fig. 5 Map of HERA CO(2–1) pointings and the relative noise in the summed spectra. The grayscale image of the relative noise was interpolated using tesselation. Darker regions correspond to lower noise levels. Contours: CO(2–1) emission distribution. |
The telescope main-beam and forward efficiencies are ηmb = 0.54 and ηfor = 0.90. At the assumed distance of NGC 4330, 17 Mpc, the CO(2–1) beam corresponds to 0.9 kpc. To convert CO integrated intensities into molecular gas masses, we assumed a N(H2)/ICO(2 − 1) ratio of 2 × 10²⁰ H2 mol cm-2 per K km s-1. Our conclusions, however, do not depend strongly on the N(H2)/ICO ratio within reasonable variations. We produced a first moment map by interpolating the CO(2–1) flux density of the pointings on a regular grid as we did in Vollmer et al. (2006).
6.2. Results
The distribution of molecular gas is shown in the upper panel of Fig. 6. The morphology consists of a strong maximum in the galactic center and an asymmetric molecular gas disk. The slight bending of the molecular gas distribution in the galactic disk is reminiscent of spiral structure. To the southwest, the molecular gas disk ends well within the Hi distribution, whereas it extends to the edge of the Hi distribution in the northeast. We observed a faint extension in the upturn region. We did not detect any extraplanar CO emission in the tail region down to a gas mass of ~6 × 10⁶ M⊙ (including helium). We also checked for faint CO emission in the gas-free galactic disk on the leading side of the interaction (northeast). No CO emission was found to a level of ~2 × 10⁶ M⊙ when 15 spectra were averaged. In contrast, we found ~2 × 10⁶ M⊙ of molecular gas in the gas-free galactic disk on the leading side of the interaction in NGC 4522 (Vollmer et al. 2006; see Sect. 10). If such a gas mass were present in the upturn region of NGC 4330, we should have detected it.
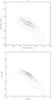 |
Fig. 6 Molecular CO(2–1) gas distribution of NGC 4330 (solid contours). Dotted contours: Hi column density distribution. Upper panel: observations. Lower panel: model. |
To determine the model molecular gas distribution of NGC 4330, we followed Vollmer et al. (2006) and weighted the particle mass with  , where ρ is the large-scale gas density. The model molecular gas distribution is shown in the lower panel of Fig. 6. The model molecular-gas surface-density distribution has a central maximum. The molecular gas disk is more extended to the northeast than the southwest. This morphology is in close agreement with our observations. However, both sides of the extended model molecular gas disk are slightly bent to the south, a behavior that is not clearly observed. In agreement with observations, no molecular gas is found in the extraplanar southwestern gas tail.
7. Radio continuum emission at 6 cm
Observations of polarized radio continuum emission can give additional information on a the interaction of a galaxy with its environment.
7.1. Observation
We observed NGC 4330 at 4.85 GHz during 6 h 40 min on December 1 and 3, 2009 with the Very Large Array (VLA) of the National Radio Astronomy Observatory (NRAO)2 in the D array configuration. The band passes were 2 × 50 MHz. We used 3C 286 as the flux calibrator and 1254+116 as the phase calibrator, the latter of which was observed every 40 min. Maps were made for both wavelengths using the AIPS task IMAGR with ROBUST = 3. The final cleaned maps were convolved to a beam size of 18″ × 18″. The rms levels of the polarized emission is 13 μJy. We obtain apparent B vectors by rotating the observed E vector by 90°, uncorrected for Faraday rotation.
7.2. Results
The observed radio-continuum emission on the Hi column density distribution is shown in Fig. 7.
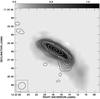 |
Fig. 7 Total power radio-continuum emission at 6 m (contour) and the Hi distribution (grayscale in Jy/beam km s-1). Contour levels are (3,5,7,10,15,20,30,40,50) × 20 μJy. |
The upturn observed in Hα/UV (Fig. 14 of Abramson et al. 2011) and CO is clearly visible in the total power emission. Moreover, the total power emission shows an asymmetry with respect to the major axis. The emission is more extended on the southeastern downwind side than on the northwestern windward side. The extraplanar Hi tail is not detected at 6 cm. However, the total emission bends strongly to the south at the western border of the galactic gas disk. This behavior is invisible at any other wavelength except 20 cm (Fig. 20 of Abramson et al. 2011). We can only speculate that the cosmic ray gas, having a low column density, is stripped more efficiently than the neutral gas. This effect was suggested by Vollmer et al. (2009) for NGC 4438 and Crowl et al. (2005) in NGC 4402. However, one would expect a compression of the cosmic ray gas, which is in contradiction with the absence of polarization in this region. Alternatively, there might be enhanced diffusion of comic ray electrons into the tail region owing to, e.g., an outflow.
The observed polarized radio continuum emission together with the magnetic field vectors on the Hi column density distribution are shown in the upper panel of Fig. 8. The polarized radio continuum emission is mainly found in the inner part of the gas disk. Its total extent along the galaxy’s major axis is ~1′. The emission is almost symmetric with respect to the major and minor axes. Two maxima are observed that follow the spiral arms detected in CO (Fig. 6). We did not detect an asymmetric ridge of polarized radio continuum emission as we did in all other ram-pressure-affected Virgo spiral galaxies (Vollmer et al. 2007). On the leading side of the interaction, we observed a faint upturn of the polarized radio continuum emission (12 23 20 +11 22 20) that is inside the Hα/total power radio-continuum upturn.
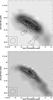 |
Fig. 8 Polarized radio continuum emission (contours) and apparent magnetic field vectors (lines) on the Hi distribution (grayscale). Upper panel: observations; contour levels are (3,4,5,6,7,8,10) × 12 μJy. Lower panel: model; contour levels are (3,4,5,6,7,8,10) times an arbitrary level. |
The magnetic field vectors are not parallel to the galactic disk as one might expect for an edge-on galaxy (see, e.g., Krause 2009). The magnetic field of the galaxy’s western side has a characteristic X-structure, which is observed in edge-on spiral galaxies with a high star-formation activity (e.g., NGC 253, Heesen et al. 2009). The field in the northern and eastern part of the X is compressed by ram pressure. On the other hand, the magnetic field in the east of the galaxy center is tilted clockwise by ~30° with respect to the disk plane. There can be two reasons for this tilt: (i) bending of the galactic regular magnetic field or (ii) enhanced Faraday rotation on the eastern side of the galactic disk. A rotation measure of −130 rad m-2 is required to rotate the E vectors by 30°, which seems possible (see below).
7.3. MHD modeling
Otmianowska-Mazur & Vollmer (2003) studied the evolution of the large-scale magnetic field during a ram pressure stripping event. They calculated the magnetic field structure by solving the induction equation on the velocity fields produced by the dynamical model. The polarized radio-continuum emission has been calculated by assuming a Gaussian spatial distribution of relativistic electrons. This procedure allowed them to study the evolution of the observable polarized radio-continuum emission during a ram pressure stripping event.
We apply the same procedure as Otmianowska-Mazur & Vollmer (1930) to a similar ram pressure stripping event (Sect. 2). We solve the induction equation  (4)where B is the magnetic induction, v is the large-scale velocity of the gas, and η is the coefficient of a turbulent diffusion, on a 3D grid (215 × 215 × 91). The cell size is 200 pc. The induction equation is solved using a second-order Godunov scheme with second-order upstream partial derivatives together with a second order Runge-Kutta scheme for the time evolution. This results in less numerical diffusion than that of the ZEUS 3D MHD code (Stone & Norman 1992a,b). We also solved the induction equation using the ZEUS code with consistent results. We provide time-dependent gas-velocity fields produced by the 3D sticky-particle simulations. The 3D velocity field obtained from the N-body code has a discrete distribution. The interpolation to a regular 3D grid was done with the Kriging method (Soida et al. 2006). We assumed the magnetic field to be partially coupled to the gas via the turbulent diffusion process (Elstner et al. 2000) assuming the magnetic diffusion coefficient to be η = 5 × 1025 cm2 s-1. We did not implement any dynamo process. The initial magnetic field is purely toroidal. The MHD model does not contain a galactic wind.
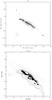 |
Fig. 9 Recent massive star formation of NGC 4330. Grayscale: Hα emission. Darker regions are regions with less Hα emission. Solid contours: molecular gas emission. Upper panel: Hα and CO(2–1) observations. Lower panel: model. Dotted contours: extinction-free column density of the model stellar disk. |
The modeled polarized radio continuum emission together with the modeled magnetic field vectors are shown in the lower panel of Fig. 8. The distribution of polarized radio continuum emission has the same extent as it is observed. This is mainly due to the truncated distribution of relativistic electrons that we assumed. The distribution is slightly more extended to the northeast. As expected, the magnetic field vectors are parallel to the galactic disk. As in the observations, there is no pronounced asymmetric ridge of polarized emission. There are two reasons why this is the case. Firstly, the interaction is slow, i.e. the duration of ram pressure stripping is shorter than that of NGC 4522, where an asymmetric ridge is observed (Vollmer et al. 2004). The gas and magnetic field compression is not strong enough to cause an asymmetric ridge. Secondly, the vector of NGC 4330’s 3D velocity vector lies in the plane of the sky. The interaction thus mainly compresses the dominating azimuthal magnetic field whose vectors are mostly parallel to the line of sight. This component of the magnetic field does not contribute to the polarized radio continuum emission. The absence of an asymmetric ridge of polarized radio continuum emission is thus clearly understandable. In addition, a compression by a factor of 2–3 of the azimuthal magnetic field in the eastern galactic disk would enhance the Faraday rotation and thus explain the tilted B vectors in this region. A direct confirmation of high the Faraday rotation measures using polarized emission at 3.6 cm and 6 cm would represent direct proof of gas and magnetic field compression within the disk at these small galactic radii.
8. Recent massive star formation
Recent massive star formation within the last ~6 Myr is traced by Hα emission. The upper panel of Fig. 9 shows the Hα emission of NGC 4330 (Abramson et al. 2011), together with the CO(2–1) emission. Within the galactic disk, the Hα emission follows the CO(2–1) emission. The northeastern upturn is visible in Hα and CO(2–1). However, the rare extraplanar Hα emission blobs within the extended Hi tail do not have a CO(2–1) counterpart. This implies that the bulk of the molecular gas from which the massive stars formed has been destroyed by stellar winds, SN explosions, and the UV radiation field. The model Hα emission obtained as described in Sect. 2.2 is shown in the lower panel of Fig. 9. The Hα emission is mainly found in the high column density gas disk. In contrast to observations, there is no upturn in the northeast of the galactic disk in the model Hα distribution. In addition, some extraplanar Hii regions are present south of the model galactic disk, which do not have observed counterparts.
9. Star formation within the last ~100 Myr
The FUV emission of galactic stellar populations is sensitive to the star formation history over the last ~100 Myr, whereas the NUV emission has decreased on a timescale of ~500 Myr. The ratio of FUV to NUV emission depends on the star formation history during the last 500 Myr and is a measure of the mean age of the underlying stellar population. Since information about the creation time of star particles is kept during the simulations, it is possible to obtain FUV and NUV emission distributions based on STARBURST99 single stellar-population fluxes. We recall that our star formation recipe based on cloud collisions only permits an enhanced star formation rate in stripped gas arms of high volume density (Fig. 2). If density inhomogeneities caused by turbulent motions in the leeward stripped gas of NGC 4330 lead to star formation that dominates this region, our model underestimates the star formation of the stripped extraplanar gas.
As shown in Abramson et al. (2011, Fig. 19) the observed NUV emission distribution displays a significant offset from the Hi emission in the extraplanar southwestern gas tail (upper panel of Fig. 10).
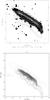 |
Fig. 10 NGC 4330 – NUV emission distribution. Upper panel: observations (Abramson et al. 2011). Contours: Hi distribution. Lower panel: model (extinction-free). Solid contours: model gas distribution. Dotted contours: extinction-free column density of the model stellar disk. |
The model NUV emission is less extended, but shows qualitatively the same trend (lower panel of Fig. 10). Moreover, several isolated extraplanar UV emission blobs are found on the downwind side to the southeast of the galactic disk (Fig. 21 of Abramson et al. 2011). These blobs are also present in the model NUV distribution.
The ratio of FUV to NUV emission depends on the age of the underlying stellar populations modified by extinction. The observed FUV/NUV ratio is high in the stellar disk, the upturn region, and the extraplanar UV tail (upper panel of Fig. 11). Most of the extraplanar regions on the downwind side are also FUV bright, i.e. they are young (≤100 Myr; Abramson et al. 2011).
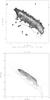 |
Fig. 11 NGC 4330 – log(FUV/NUV). Darker areas have a lower log (FUV/NUV). Upper panel: observations (Abramson et al. 2011). Contours: Hi distribution. Lower panel: model (extinction-free). Solid contours: model gas distribution. Dotted contours: extinction-free column density of the model stellar disk. |
The extinction-free model FUV/NUV fraction is shown in the lower panel of Fig. 11. In addition, we show in Fig. 12 cuts along the major axis.
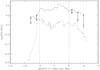 |
Fig. 12 log(FUV/NUV) along the major axis. Dashed line: GALEX observations (Abramson et al. 2011). Solid line: model. The vertical dotted lines indicate the gas truncation radius. Triangles: log(FUV/NUV) within six radial bins. Arrows: reddening of the UV color owing to the inclusion of a constant stellar age distribution during t = −2 Gyr and t = −0.5 Gyr before the time of interest (cf. Fig. 14). |
Owing to the missing extinction, the model FUV/NUV fraction within the gas disk (R < 5 kpc) cannot be directly compared to observations. As observed, the UV emitting regions within the galactic disk beyond the Hi truncation radius have a significantly smaller FUV/NUV ratio than that of the region within the Hi distribution. The observed variation in log (FUV/NUV) on the leading side (upturn region) is much steeper than that of the model. Whereas the model log (FUV/NUV) never decreases below 0.15, the observed log (FUV/NUV) reaches values <−0.2. On the trailing side (tail region), the difference between the observed and the model log (FUV/NUV) is less important than on the leading side, but is still significant (up to Δ log (FUV/NUV) ~ 0.2.
Our model stellar populations are no older than 600 Myr. Since the UV profiles are taken along the major axis within the galactic disk, old stellar populations of the galactic disk should also be present in the GALEX observations. If we add a constant stellar age distribution from − 2 Gyr to − 0.5 Gyr, log (FUV/NUV) decreases by up to 0.1 in the outer parts of the disk. This is illustrated by the arrows in Fig. 12. Even with this modification, the observed low values of log (FUV/NUV) in the upturn region are not attained.
In the model, all extraplanar regions are young with a log (FUV/NUV) ~ 0.3, i.e. their FUV/NUV ratios are larger than those of the disk. Seven out of the nine extraplanar UV-emitting regions found by Abramson et al. (2011) have similar FUV/NUV fractions (log (FUV/NUV) ≥ 0.25).
We thus conclude that, whereas the observed log (FUV/NUV) of the tail can be reproduced by adding an old stellar population (2–5 Gyr), the observed log (FUV/NUV) of the upturn region differs largely from the model by ~0.2 mag.
10. The overall picture
By comparing the Hi, CO, Hα, UV, and radio continuum observations with the dynamical modeling the following overall picture arises: NGC 4330 moves approximately northward within the Virgo intracluster medium, which is assumed to be static (see also Vollmer 2009). The line-of-sight velocity component is small compared to the velocity components in the plane of the sky. The inclination angle between the disk and orbital plane is ~75°, i.e. the ram pressure wind blows more face on. This small deviation from a face-on wind is enough to cause the observed Hi, CO, Hα, UV, and the radio continuum asymmetries between the two extremities of the galactic disk. The projected wind angle is between 60° and 80°. The current ram pressure acting on NGC 4330 is prps ~ 2500 cm-3 (km s-1)2. On the basis of the orbital segment given in Vollmer (2009), a maximum ram pressure of ~5000 cm-3 (km s-1)2 will occur in ~100 Myr.
On the leading side of the interaction (northeast), an upturn is observed in Hα, UV (Fig. 15 of Abramson et al. 2011), as well as in CO and 6 cm radio continuum emission. We did not find atomic, molecular, or cosmic ray gas beyond the upturn region. This suggests that the ISM is stripped as a whole entity. We excluded the possibility that gas, which was initially left behind, rapidly formed stars, because we do not detect either Hα or FUV-excess emission sources beyond the upturn region. The only possible explanation of the absence of dense gas, which might not be affected by ram pressure and which might stay behind the less dense gas, is a rapid mixing into the hot intracluster medium.
It is useful to compare the observed properties of NGC 4330 to those of NGC 4522, another strongly stripped Virgo spiral galaxy. Compared to NGC 4522, NGC 4330 has the same inclination angle between the disk and orbital plane and the same maximum ram pressure. Both Hi distributions are strongly truncated and show significant extraplanar Hi emission (Kenney et al. 2004). On the other hand, there are three important differences between NGC 4522 and NGC 4330: (i) whereas NGC 4522 is observed shortly (~50 Myr) after peak ram pressure (Vollmer et al. 2006), NGC 4330 is in a pre-peak (~−100 Myr) phase; (ii) the width of the ram pressure profile of NGC 4330 is 20% larger than that of NGC 4522; and (iii) the dominant component of the 3D velocity vector is along the line-of-sight for NGC 4522, whereas it is in the plane of the sky for NGC 4330.
Observationally, there are two main differences between NGC 4330 and NGC 4522: NGC 4522 contains an asymmetric ridge of polarized radio continuum emission (Vollmer et al. 2004) and molecular gas beyond the leading edge of the interaction (Vollmer et al. 2008). Both features are not observed in NGC 4330. As already mentioned in Sect. 7.3, the absence of an asymmetric ridge of polarized radio continuum emission can be explained by the projection of NGC 4330: since the galaxy moves predominantly in the plane of the sky, ram pressure compresses mainly the magnetic field component along the line of sight, which does not contribute to the polarized radio continuum emission. However, we checked the face-on view of the modeled polarized radio continuum emission and did not find a pronounced ridge in the wind direction. This means that the slowly rising compression of the ISM and its associated magnetic field in NGC 4330 is still not strong enough to produce a pronounced ridge of polarized radio continuum emission.
Could the absence of CO emission beyond the upturn region in NGC 4330 also be understood in terms of projection effects? To answer this question, we have to compare the interaction timescale, i.e. the time taken to clear a region in the galactic disk, the lifetime of a molecular cloud, and the rotation period. The lifetime of a giant molecular cloud (GMC) is roughly given by its free-fall time. With a density of ~100 cm-3, the free-fall time is a few Myr. In NGC 4522, the compression occurs to the east of the galaxy center and rotation transports the dense molecular clouds that decoupled from the ram pressure wind to the north where they are detected today. With a rotation velocity of 100 km s-1, a molecular cloud at a radius of 3 kpc moves by an angle of ~90° within 50 Myr. The interaction timescale is of the order of ~10 Myr. This implies that the observed GMCs beyond the gas truncation radius might be longer lived than expected from the free-fall timescale. A possible mechanism is an enhanced ionization of the molecular gas due to cosmic ray particles created in the ram-pressure compression region.
In NGC 4330, a molecular cloud at the Hi truncation radius (~6 kpc) also needs ~50 Myr to move by ~90°. However, these clouds are then hidden behind the galactic disk. Thus, only GMCs that recently (<20 Myr) decoupled from the the rest of the ISM can be detected beyond the gas truncation radius. Since ram pressure is still increasing, increasingly dense clouds should decouple from the wind and stay behind. However, the interaction timescale is longer for NGC 4330 (pre-peak with tHW = 100 Myr) than for NGC 4522 (close to peak with tHW = 80 Myr). If the interaction timescale is longer than the lifetime of the GMCs, the ISM is stripped as a whole entity and the GMCs form stars or are dispersed within the ISM. In both cases, no CO emission is expected beyond the gas truncation radius. The comparison with NGC 4522 suggests that it needs a higher and/or a more rapidly increasing ram pressure so that a significant amount of dense molecular gas (>5 × 10⁶ M⊙) decouples from the ram pressure wind.
The gas tail of NGC 4330 consists only of atomic hydrogen and the UV tail is upwind from the Hi tail. The case of NGC 4522 (Vollmer et al. 2006) suggested that the extraplanar gas, which is stripped in an arm structure, forms stars with an efficiency close to that of the galactic disk as long as the large-scale density is high enough. We checked this possibility for NGC 4330 and found that most of the stars that form the UV tail today were born in three distinct gas arm structures at vertical distances z < 5 kpc from the galactic disk within the last ~50 Myr. With a free-fall time of a few Myr, a collapsing starforming cloud rapidly decouples from the ram pressure wind and evolves like a collisionless particle. The orbit of the newly created star is thus given by its initial position and velocity at the moment of decoupling, i.e. they retain the angular momentum of the gas at the time of their creation. On the other hand, the gas is continuously accelerated by ram pressure, constantly gaining angular momentum. This creates the offset between the UV and Hi tail.
It is possible to verify this mechanism with our dynamical simulation. For this, we calculated the deviation angle of (i) the angular momentum of the newly created tail stars and (ii) the extraplanar gas tail of different densities from the angular momentum of the disk (Fig. 13). The tail region for the stars is defined to be 3 kpc ≤ RA ≤ 10 kpc and − 10 kpc ≤ Dec ≤ −5 kpc in Fig. 11. The tail region for the gas is defined as the region with a vertical distance >1.2 kpc from the galactic disk. The small-scale variation in the evolution of the deviation angle of the young stars is due to individual stars entering and leaving the tail region. The offset between the deviation angle of the young stars with ages younger than 200 Myr and that of the gas increases with decreasing gas density. Low density gas is thus pushed further away from the disk than the newly created stars that form in high density gas. The gas tail is thus pushed increasingly further away from the UV tail, which consists of stars that are no longer affected by ram pressure.
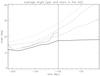 |
Fig. 13 Evolution of the angle between the angular momentum of the disk and that of: (i) gas at three different volume densities (dash-dotted: n0, dashed: 0.2 × n0, dotted: n = 0.04 × n0); (ii) newly born tail stars younger than 10 Myr (solid line); and (iii) all young tail stars with ages younger than 200 Myr (thick solid line). |
Whereas the Hi, CO, Hα, and dust extinction observations suggest a recent stripping of the outer galactic disk (~100 Myr), the FUV-NUV and NUV-r colors are consistent with a much older stripping ( ≥ 200 Myr) of these regions (Abramson et al. 2011 and Fig. 12). As discussed by Abramson et al. (2011), the FUV-NUV and NUV-r colors cannot be explained by simple quenching models of a previously constant star-formation rate. The reconstruction of the stellar age distribution from deep optical spectra (Crowl & Kenney 2008; Pappalardo et al. 1910) might solve the problem.
11. The stellar age distribution of the outer disk
As discussed in Sect. 2.2, stars are created during cloud-cloud collisions in the dynamical model. Each newly created star retains the information about its creation time during the simulation, which begins 600 Myr before the ram pressure maximum. In the following, we define t = 0 Myr as the time of observations, i.e. 100 Myr before peak ram pressure. Stellar age distributions are determined within the galactic disk (|z| < 1 kpc) within three radial bins outside the gas truncation radius: (i) 5 kpc < R < 7 kpc, (ii) 7 kpc < R < 9 kpc; and (iii) 9 kpc < R < 11 kpc. This corresponds to the age distributions of the newly created stellar particles within the radial bins (Fig. 14).
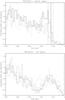 |
Fig. 14 Model stellar age distribution within radial bins outside the gas truncation radius. Dotted line: 5 kpc < R < 7 kpc. Solid line: 7 kpc < R < 9 kpc. Dashed line: 9 kpc < R < 11 kpc. Upper panel: upturn region. The vertical lines correspond to the quenching time for which the age distribution has dropped by a factor of two from its initial value. Lower panel: gas tail region. |
Following Pappalardo et al. (2010), we define the quenching time as the time for which the age distribution has dropped by a factor two from its initial value.
In the upturn region, there is a clear gradient in the quenching times for the different radial bins of (i) −95 Myr; (ii) −130 Myr; and (iii) −160 Myr. On the other hand, the quenching times of the outer two radial bins in the tail region are ~−350 Myr. After this drop, the stellar age distribution remains approximately constant until − 50 Myr, when it begins to decrease again. The stellar age distribution of the inner radial bin is that of a perfectly normal starforming disk with passing spiral arms that are responsible for the different peaks in star formation. In this disk area, the model gas disk still has a high surface density in contrast to observations (Fig. 3).
It is not straightforward to link the stellar age distribution to the evolution of the gas surface density, because the structure of the gas disk is rapidly evolving during the ram pressure stripping event. Existing spiral arms are reshaped and sometimes additional ones are created. Stars form mainly in the dense gas of these spiral arms. To illustrate this situation, we show in Fig. 15 the gas surface density distributions of the three quenching times of the upper panel of Fig. 14. At each timestep, the gas disk has a complex asymmetric spiral structure with three main arms. At t = −90 Myr, the spiral arm at the leading side is at a distance of 5 kpc. It is not obvious how a gas truncation radius can be defined on the leading (left) side of the interaction to compare it to the quenching times.
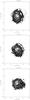 |
Fig. 15 Model gas surface density distribution within the galactic disk (|z| < 1 kpc) at the three quenching times of the upper panel of Fig. 14. Darker regions correspond to lower surface densities. The timestep of the snapshots are marked on top of each panel, t = 0 corresponds to maximum ram pressure. The ram-pressure wind blows from the left side. The vertical lines represent a truncation radius of 5 kpc on the leading and trailing side of the interaction at t = 0. |
Nevertheless, we determined the radius at which the gas surface density within the disk (|z| < 1 kpc) declines to a given value Σ0 at the leading (left) and trailing (right) side of the interaction. The value of Σ0 is chosen to ensure that there is the same truncation radius on both sides today.
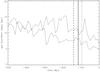 |
Fig. 16 Model gas truncation radius at the leading (lower graph) and trailing (upper graph) side of the interaction. The vertical line show the quenching ages of the upper panel of Fig. 14. |
Owing to the non-zero inclination angle between the disk and the ram pressure wind of 25°, the gas is pushed within the galactic disk towards the right. Thus, the trailing side of the gas disk is more extended than the leading side for most of the considered time interval. At the same time, the gas is pushed vertically out of the disk plane. This symmetrizes the gas distribution within the galactic disk (|z| < 1 kpc). The variation in the truncation radius on short timescales is caused by the passage of spiral arms. Between − 150 Myr and − 80 Myr, the truncation radius of the leading side decreases more rapidly than that of the trailing side. This trend is, however, much less clear than the signature of ram pressure in the evolution of the quenching time. We thus conclude that it is necessary to include star formation over the last ~0.5 Gyr to ensure a meaningful comparison between the observed and model quenching times.
12. Conclusions
In a series of detailed examinations of ram-pressure-stripped Virgo spiral galaxies, NGC 4330 is the second case after NGC 4501 where the galaxy is still approaching the cluster center and ram pressure is continuing to increase in intensity. The edge-on projection ensures that the identification of extraplanar gas and star formation are both possible. Abramson et al. (2011) found that the Hα and dust extinction distributions show an upturn at the leading side of the interaction (their Figs. 7 and 15). On the opposite side, Hi and UV tails are detected with a significant offset between the two tails. The UV colors display a radial age gradient in the youngest stellar populations of the gas-free part of the upturn region. On the tail side, no such gradient has been found.
In this article, we have presented new CO(2–1) and 6 cm radio continuum emission observations of NGC 4330. The available multiwavelength observations (UV, Hα, Hi, CO, 6 cm total power radio continuum, 6 cm polarized radio continuum) are compared to a dynamical model including ram pressure stripping and, for the first time, star formation. The distribution of molecular gas in the galactic disk is more extended towards the upturn region. The upturn itself is visible in both CO and radio continuum emission. Neither CO nor radio continuum emission is detected in the gas tail. As for the Hi emission, the 6 cm total power radio continuum emission is less extended along the minor axis than on the windward side. There is a second radio continuum upturn region on the tail side. This second upturn is only visible in radio continuum emission. The polarized radio continuum emission is relatively symmetric and, in contrast to other Virgo spirals affected by ram pressure, does not show an asymmetric ridge in the outer disk.
The best-fit model has been chosen from a series of simulations with different (i) inclination angles between the ram pressure wind and the disk plane; (ii) values of the maximum ram pressure; and (iii) durations of the ram pressure stripping event. The best-fit model is consistent with the galaxy’s projected position and radial velocity in the Virgo cluster and the model gas distribution and velocity field reproduce the Hi observations. NGC 4330 experiences a ram pressure of prps = 2500 cm-3 (km s-1)2 and the angle between the ram pressure wind and the galactic plane is 75°. On the basis of the orbital segment given in Vollmer (2009), a maximum ram pressure of ~5000 cm-3 (km s-1)2 will occur in ~100 Myr.
A range of UV, Hα, CO, and Hi maps have been derived from the best-fit model snapshot. From the comparison between the dynamical model and observations, we conclude that:
-
1.
The model reproduces qualitatively the observed atomic andmolecular gas distribution. The morphology of the model gas tailis different for simulations with and without gas shadowing. Themodels are unable to reproduce simultaneously the observeddiscontinuity and angle of the gas tail.
-
2.
In the framework of the model, it is impossible to explain the much stronger bending of the radio continuum tail with respect to the gas tail. More efficient stripping of the cosmic ray gas or enhanced diffusion of cosmic ray electrons might be at work.
-
3.
The absence of an asymmetric ridge of polarized radio continuum emission is due to a slow compression of the ISM and the particular projection of NGC 4330, which has a small line-of-sight component of the galaxy’s 3D velocity vector.
-
4.
The spatial offset between the Hi and UV tail is well reproduced. Since collapsing and starforming gas clouds decouple from the ram pressure wind, the UV-emitting young stars retain the angular momentum of the gas at the time of their creation. On the other hand, the gas is constantly pushed by ram pressure and is thus constantly changing angular momentum.
-
5.
The UV color profile along the major axis is reproduced qualitatively by the model with a smaller FUV/NUV ratio in the northeastern upturn region than in the tail region. However, the observed very small FUV/NUV ratio in the upturn region is not reproduced by the model. Whereas the Hi, CO, Hα, dust extinction observations, and the dynamical model suggest a more recent gas stripping of the outer galactic disk (~100 Myr), the UV color indicates an older stripping ( ≥ 200 Myr) of this region (Abramson et al. 2011). To investigate this discrepancy, we have provided stellar age distributions within three radial bins in the galactic disk (R > 5 kpc). The star-formation quenching ages based on these stellar age distributions can be verified by the stellar population synthesis inversion of deep optical spectra (Crowl & Kenney 2008; Pappalardo et al. 1910).
-
6.
Due to a complex evolving gas distribution, it is necessary to include star formation over the last ~0.5 Gyr in the model to make a meaningful comparison between the observed and model star formation quenching times.
We are now at the point where we can study the reaction (phase change, star formation) of the multiphase ISM (molecular, atomic, ionized) to ram pressure. It seems that the ISM is stripped as a whole entity and that only a tiny fraction of dense clouds can be left behind (see also Vollmer et al. 2006). Extraplanar star formation proceeds in dense gas arms pushed by ram pressure. The collapsing clouds decouple rapidly from the ram pressure wind and the young, UV-emitting stars stay behind the gas. More high-resolution multiwavelength studies of ram-pressure-stripped galaxies are necessary to confirm and refine these hypotheses.
Acknowledgments
B.V. would like to thank the MPIfR (P. Reich) for computational support. This work has been supported by the Polish Ministry of Science and Higher Education grants 92/N-ASTROSIM/2008/0 and 3033/B/H03/2008/35. This work has also been supported by the National Research Foundation of Korea grant 2011-8-0993, Yonsei research grant 2010-1-0200 and 2011-1-0096. Support was also provided by the National Research Foundation of Korea to the Center for Galaxy Evolution Research.
References
- Abramson, A., Kenney, J. D. P., Crowl, H., et al. 2011, AJ, 141, 164 [NASA ADS] [CrossRef] [Google Scholar]
- Bigiel, F., Leroy, A., Walter, F., et al. 2008, AJ, 136, 2846 [NASA ADS] [CrossRef] [Google Scholar]
- Boulares, A., & Cox, D. P. 1990, ApJ, 365, 544 [NASA ADS] [CrossRef] [Google Scholar]
- Cayatte, V., van Gorkom, J. H., Balkowski, C., & Kotanyi, C. 1990, AJ, 100, 604 [NASA ADS] [CrossRef] [Google Scholar]
- Chamaraux, P., Balkowski, C., & Gérard, E. 1980, A&A, 83, 38 [NASA ADS] [Google Scholar]
- Chung, A., van Gorkom, J. H., Kenney, J. D. P., & Vollmer, B. 2007, ApJ, 659, L115 [NASA ADS] [CrossRef] [Google Scholar]
- Chung, A., van Gorkom, J. H., Kenney, J. D. P., et al. 2009, A&A, 138, 1741 [Google Scholar]
- Crowl, H. H., & Kenney, J. D. P. 2008, AJ, 136, 1623 [NASA ADS] [CrossRef] [Google Scholar]
- Crowl, H. H., Kenney, J. D. P., van Gorkom, J. H., & Vollmer, B. 2005, AJ, 130, 65 [NASA ADS] [CrossRef] [Google Scholar]
- Elmegreen, B. G., & Falgaron, E. 1996, ApJ, 471, 816 [NASA ADS] [CrossRef] [Google Scholar]
- Elstner, D., Otmianowska-Mazur, K., von Linden, S., & Urbanik, M. 2000, A&A, 357, 129 [NASA ADS] [Google Scholar]
- Fumagalli, M., Krumholz, M. R., Prochaska, J. X., Gavazzi, G., & Boselli, A. 2009, ApJ, 697, 1811 [NASA ADS] [CrossRef] [Google Scholar]
- Giovanelli, R., & Haynes, M. P. 1983, AJ, 88, 881 [NASA ADS] [CrossRef] [Google Scholar]
- Heesen, V., Krause, M., Beck, R., & Dettmar, R.-J. 2009, A&A, 506, 1123 [CrossRef] [EDP Sciences] [Google Scholar]
- Kenney, J. P. D., & Young, J. S. 1989, ApJ, 384, 171 [NASA ADS] [CrossRef] [Google Scholar]
- Kenney, J. P. D., van Gorkom, J. H., & Vollmer, B. 2004, AJ, 127, 3361 [NASA ADS] [CrossRef] [Google Scholar]
- Krause, M. 2009, in Magnetic Fields in the Universe II: From Laboratory and Stars to the Primordial Universe, ed. A. Esquivel, J. Franco & G. Garcua-Segura, Rev. Mex. Astron. Astrofis. Ser. Conf., 36, 25 [Google Scholar]
- Leitherer, C., Schaerer, D., Goldader, J., et al. 1999, ApJS, 123, 3 [NASA ADS] [CrossRef] [Google Scholar]
- Otmianowska-Mazur, K., & Vollmer, B. 2003, A&A, 402, 879 [NASA ADS] [CrossRef] [EDP Sciences] [Google Scholar]
- Pappalardo, C., Lançon, A., Vollmer, B., et al. 2010, A&A, 514, 33 [Google Scholar]
- Roediger, E., & Brüggen, M. 2006, MNRAS, 369, 567 [NASA ADS] [CrossRef] [Google Scholar]
- Roediger, E., & Brüggen, M. 2008, MNRAS, 388, L89 [Google Scholar]
- Schulz, S., & Struck, C. 2001, MNRAS, 328, 185 [NASA ADS] [CrossRef] [Google Scholar]
- Soida, M., Otmianowska-Mazur, K., Chyzy, K., & Vollmer, B. 2006, A&A, 458, 727 [NASA ADS] [CrossRef] [EDP Sciences] [Google Scholar]
- Stone, J. M., & Norman, M. L. 1992a, ApJS, 80, 753 [Google Scholar]
- Stone, J. M., & Norman, M. L. 1992b, ApJS, 80, 791 [Google Scholar]
- Vollmer, B. 2009, A&A, 502, 427 [NASA ADS] [CrossRef] [EDP Sciences] [Google Scholar]
- Vollmer, B., Cayatte, V., Balkowski, C., & Duschl, W. J. 2001, ApJ, 561, 708 [NASA ADS] [CrossRef] [Google Scholar]
- Vollmer, B., Beck, R., Kenney, J. P. D., & van Gorkom, J. H. 2004, AJ, 127, 3375 [NASA ADS] [CrossRef] [Google Scholar]
- Vollmer, B., Soida, M., Otmianowska-Mazur, K., et al. 2006, A&A, 453, 883 [NASA ADS] [CrossRef] [EDP Sciences] [Google Scholar]
- Vollmer, B., Soida, M., Beck, R., et al. 2007, A&A, 464, L37 [NASA ADS] [CrossRef] [EDP Sciences] [Google Scholar]
- Vollmer, B., Braine, J., Pappalardo, C., & Hily-Blant, P. 2008, A&A, 491, 455 [NASA ADS] [CrossRef] [EDP Sciences] [Google Scholar]
- Vollmer, B., Soida, M., Chung, A., et al. 2009, A&A, 496, 669 [NASA ADS] [CrossRef] [EDP Sciences] [Google Scholar]
- Wiegel, W. 1994, Diploma Thesis, University of Heidelberg [Google Scholar]
Appendix A: The model star-formation law
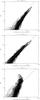 |
Fig. A.1 The model star-formation law. Upper panel: as a function of the total gas surface density. Middle panel: as a function of the molecular gas surface density. Lower panel: as a function of the atomic gas surface density. The solid lines show power-law fits with exponents 1.7 (total) and 1.2 (molecular). The solid line in the lower panel is there to guide the eye. Star formation is assumed to be proportional to the unobscured model UV emission (in arbitrary units). The molecular gas surface density is calculated by assuming that |

All Tables
Total mass, number of particles N, particle mass M, and smoothing length l for the different galactic components.
All Figures
|
Fig. 1 Snapshots of the four ram-pressure stripping simulations. The ram pressure maximum in units of 100 cm-3 (km s-1)2, the duration tHW, and the inclination angle between the orbital and galactic disk plane i are shown on top of each panel. The timestep with respect to the ram pressure maximum are shown in the lower left corner of each panel. The arrow indicates the direction of the ram pressure wind where its size is proportional to the ram pressure strength. The stellar disk is shown in grayscale where lower column densities are darker. The gas is shown as contours. The best-fit model (p = 5000 cm-3 (km s-1)2, t = −100 Myr, i = 75°) is labeled “model”. |
| In the text | |
|
Fig. 2 Face-on model Hi distribution. Upper panel: initial condition (t = −600 Myr). Lower panel: best-fit model (t = −100 Myr). The galaxy moves to the left, i.e. the ram pressure wind blows from the left. The low surface density gas at RA < −8 kpc is located at high latitudes, i.e. it is extraplanar. The contour levels are (1,2,4,8,16,32,64) × 10-19 cm-2. |
| In the text | |
|
Fig. 3 Gas distributions and associated position velocity diagrams. Upper panel: Hi observations (grayscale and contours; Chung et al. 2009). The contour levels of the Hi distribution are (1,2,4,8,16,32,64) × 10-19 cm-2. The beam is shown in the lower left corner. Lower panel: grayscale: observed Hi distribution. Contours: model atomic-gas distribution. The relative contour levels are same as those of the Hi distribution. |
| In the text | |
|
Fig. 4 Model without gas shadowing. The relative contour levels are the same as those of the Hi distribution in Fig. 3. |
| In the text | |
|
Fig. 5 Map of HERA CO(2–1) pointings and the relative noise in the summed spectra. The grayscale image of the relative noise was interpolated using tesselation. Darker regions correspond to lower noise levels. Contours: CO(2–1) emission distribution. |
| In the text | |
|
Fig. 6 Molecular CO(2–1) gas distribution of NGC 4330 (solid contours). Dotted contours: Hi column density distribution. Upper panel: observations. Lower panel: model. |
| In the text | |
|
Fig. 7 Total power radio-continuum emission at 6 m (contour) and the Hi distribution (grayscale in Jy/beam km s-1). Contour levels are (3,5,7,10,15,20,30,40,50) × 20 μJy. |
| In the text | |
|
Fig. 8 Polarized radio continuum emission (contours) and apparent magnetic field vectors (lines) on the Hi distribution (grayscale). Upper panel: observations; contour levels are (3,4,5,6,7,8,10) × 12 μJy. Lower panel: model; contour levels are (3,4,5,6,7,8,10) times an arbitrary level. |
| In the text | |
|
Fig. 9 Recent massive star formation of NGC 4330. Grayscale: Hα emission. Darker regions are regions with less Hα emission. Solid contours: molecular gas emission. Upper panel: Hα and CO(2–1) observations. Lower panel: model. Dotted contours: extinction-free column density of the model stellar disk. |
| In the text | |
|
Fig. 10 NGC 4330 – NUV emission distribution. Upper panel: observations (Abramson et al. 2011). Contours: Hi distribution. Lower panel: model (extinction-free). Solid contours: model gas distribution. Dotted contours: extinction-free column density of the model stellar disk. |
| In the text | |
|
Fig. 11 NGC 4330 – log(FUV/NUV). Darker areas have a lower log (FUV/NUV). Upper panel: observations (Abramson et al. 2011). Contours: Hi distribution. Lower panel: model (extinction-free). Solid contours: model gas distribution. Dotted contours: extinction-free column density of the model stellar disk. |
| In the text | |
|
Fig. 12 log(FUV/NUV) along the major axis. Dashed line: GALEX observations (Abramson et al. 2011). Solid line: model. The vertical dotted lines indicate the gas truncation radius. Triangles: log(FUV/NUV) within six radial bins. Arrows: reddening of the UV color owing to the inclusion of a constant stellar age distribution during t = −2 Gyr and t = −0.5 Gyr before the time of interest (cf. Fig. 14). |
| In the text | |
|
Fig. 13 Evolution of the angle between the angular momentum of the disk and that of: (i) gas at three different volume densities (dash-dotted: n0, dashed: 0.2 × n0, dotted: n = 0.04 × n0); (ii) newly born tail stars younger than 10 Myr (solid line); and (iii) all young tail stars with ages younger than 200 Myr (thick solid line). |
| In the text | |
|
Fig. 14 Model stellar age distribution within radial bins outside the gas truncation radius. Dotted line: 5 kpc < R < 7 kpc. Solid line: 7 kpc < R < 9 kpc. Dashed line: 9 kpc < R < 11 kpc. Upper panel: upturn region. The vertical lines correspond to the quenching time for which the age distribution has dropped by a factor of two from its initial value. Lower panel: gas tail region. |
| In the text | |
|
Fig. 15 Model gas surface density distribution within the galactic disk (|z| < 1 kpc) at the three quenching times of the upper panel of Fig. 14. Darker regions correspond to lower surface densities. The timestep of the snapshots are marked on top of each panel, t = 0 corresponds to maximum ram pressure. The ram-pressure wind blows from the left side. The vertical lines represent a truncation radius of 5 kpc on the leading and trailing side of the interaction at t = 0. |
| In the text | |
|
Fig. 16 Model gas truncation radius at the leading (lower graph) and trailing (upper graph) side of the interaction. The vertical line show the quenching ages of the upper panel of Fig. 14. |
| In the text | |
|
Fig. A.1 The model star-formation law. Upper panel: as a function of the total gas surface density. Middle panel: as a function of the molecular gas surface density. Lower panel: as a function of the atomic gas surface density. The solid lines show power-law fits with exponents 1.7 (total) and 1.2 (molecular). The solid line in the lower panel is there to guide the eye. Star formation is assumed to be proportional to the unobscured model UV emission (in arbitrary units). The molecular gas surface density is calculated by assuming that |
| In the text | |
Current usage metrics show cumulative count of Article Views (full-text article views including HTML views, PDF and ePub downloads, according to the available data) and Abstracts Views on Vision4Press platform.
Data correspond to usage on the plateform after 2015. The current usage metrics is available 48-96 hours after online publication and is updated daily on week days.
Initial download of the metrics may take a while.