Free Access
Fig. 5
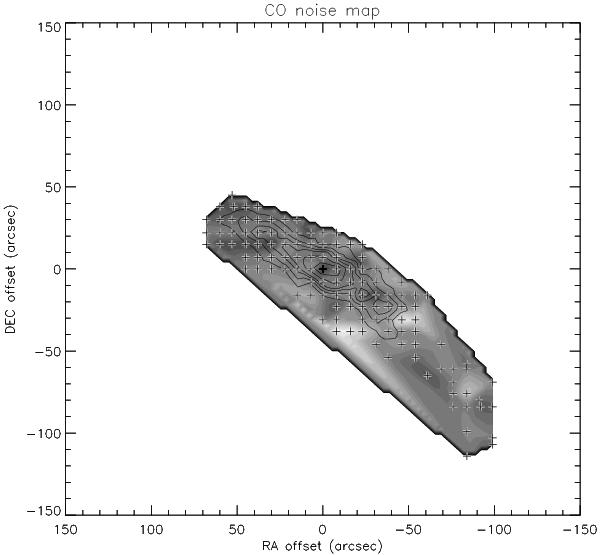
Map of HERA CO(2–1) pointings and the relative noise in the summed spectra. The grayscale image of the relative noise was interpolated using tesselation. Darker regions correspond to lower noise levels. Contours: CO(2–1) emission distribution.
Current usage metrics show cumulative count of Article Views (full-text article views including HTML views, PDF and ePub downloads, according to the available data) and Abstracts Views on Vision4Press platform.
Data correspond to usage on the plateform after 2015. The current usage metrics is available 48-96 hours after online publication and is updated daily on week days.
Initial download of the metrics may take a while.