Fig. 15
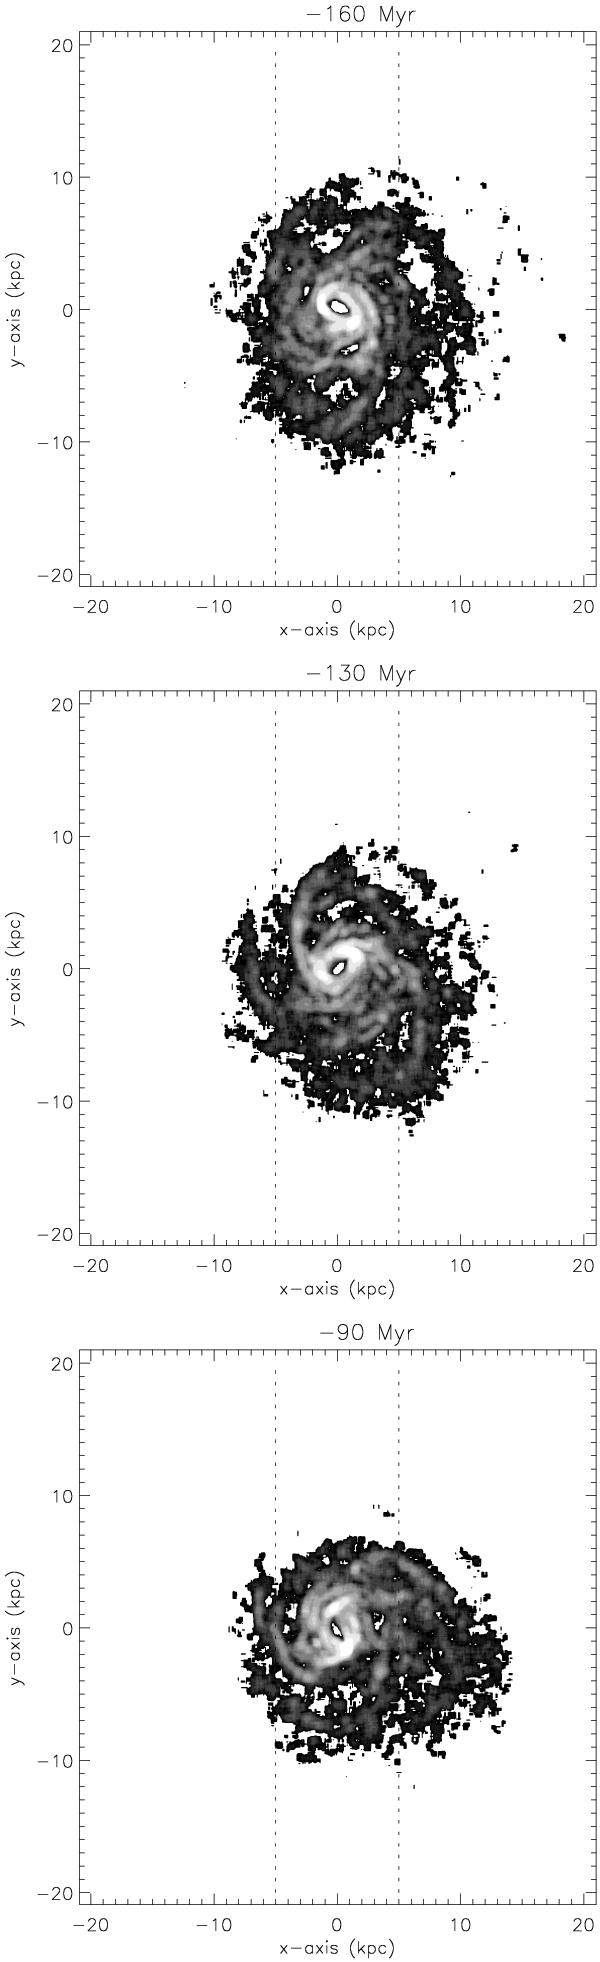
Model gas surface density distribution within the galactic disk (|z| < 1 kpc) at the three quenching times of the upper panel of Fig. 14. Darker regions correspond to lower surface densities. The timestep of the snapshots are marked on top of each panel, t = 0 corresponds to maximum ram pressure. The ram-pressure wind blows from the left side. The vertical lines represent a truncation radius of 5 kpc on the leading and trailing side of the interaction at t = 0.
Current usage metrics show cumulative count of Article Views (full-text article views including HTML views, PDF and ePub downloads, according to the available data) and Abstracts Views on Vision4Press platform.
Data correspond to usage on the plateform after 2015. The current usage metrics is available 48-96 hours after online publication and is updated daily on week days.
Initial download of the metrics may take a while.