Fig. 1
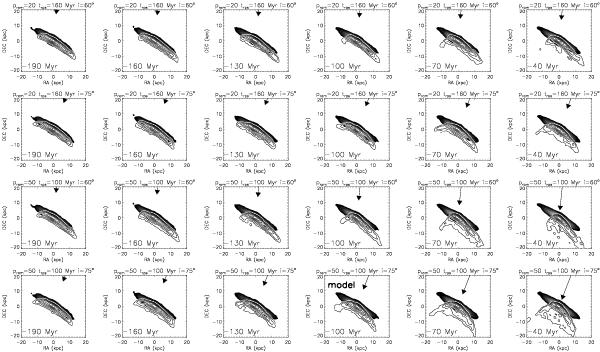
Snapshots of the four ram-pressure stripping simulations. The ram pressure maximum in units of 100 cm-3 (km s-1)2, the duration tHW, and the inclination angle between the orbital and galactic disk plane i are shown on top of each panel. The timestep with respect to the ram pressure maximum are shown in the lower left corner of each panel. The arrow indicates the direction of the ram pressure wind where its size is proportional to the ram pressure strength. The stellar disk is shown in grayscale where lower column densities are darker. The gas is shown as contours. The best-fit model (p = 5000 cm-3 (km s-1)2, t = −100 Myr, i = 75°) is labeled “model”.
Current usage metrics show cumulative count of Article Views (full-text article views including HTML views, PDF and ePub downloads, according to the available data) and Abstracts Views on Vision4Press platform.
Data correspond to usage on the plateform after 2015. The current usage metrics is available 48-96 hours after online publication and is updated daily on week days.
Initial download of the metrics may take a while.