


| Issue |
A&A
Volume 711, July 2026
|
|
|---|---|---|
| Article Number | A64 | |
| Number of page(s) | 16 | |
| Section | Atomic, molecular, and nuclear data | |
| DOI | https://doi.org/10.1051/0004-6361/202660442 | |
| Published online | 02 July 2026 | |
The reaction of P+ with H2O (D2O): A pathway for the formation of PO and PO+ in the interstellar medium and circumstellar envelopes
1
Dipartimento di Fisica, Università di Trento,
Via Sommarive 14,
38123 Trento,
Italy
2
Dipartimento di Chimica, Biologia e Biotecnologie, Università degli Studi di Perugia,
via Elce di Sotto, 8,
06123 Perugia,
Italy
3
Dipartimento di Ingegneria Civile ed Ambientale, Università degli Studi di Perugia,
via G. Duranti,
Perugia,
Italy
4
Univ. Grenoble Alpes, CNRS, Institut de Planétologie et d’Astrophysique de Grenoble (IPAG),
38000 Grenoble,
France
★★ Corresponding author: This email address is being protected from spambots. You need JavaScript enabled to view it.
Received:
15
April
2026
Accepted:
19
May
2026
Abstract
Context. Interstellar phosphorus shows uncertain depletion patterns and an unidentified main reservoir, with only a few P-bearing molecules detected despite their key astrochemical and astrobiological relevance. In particular, recent observations of PO+ with a high abundance with respect to PO suggest that ion–molecule chemistry may play a crucial role, motivating a reassessment of its formation pathways in the interstellar medium (ISM) and circumstellar envelopes.
Aims. The role of the reaction between P+ and water (D2O) for the synthesis of PO+ and POH+ is explored in a joint experimental and theoretical study. Furthermore, new possible routes leading to the conversion of i) POH+ into PO (via a non-dissociative proton transfer reaction with ammonia) and of ii) PO into PN (via the adiabatic barrierless reaction of N(4S) with PO are proposed.
Methods. The reaction P+ plus D2O was studied experimentally by measuring absolute cross-sections (CSs) and branching ratios (BRs), as a function of collision energy. Experiments were supported by a theoretical investigation combining high-level electronic structure calculations of the multidimensional triplet and singlet potential energy surfaces with a kinetic investigation to derive BRs and channel-specific rate constants as a function of temperature in the 10–5000 K range.
Results. The reaction P+ + D2O leads mostly to POD+ plus D (BR = 90%), with PO+ plus D2 being a minor channel (BR=10%). From the total reaction CS as a function of collision energy, estimates for the rate constant as a function of temperature have been obtained, with values ranging from 1.2 × 10⁻⁹ cm3s−1 (at 10 K) to 7.5 × 10⁻¹⁰ cm3s−1 (at 5000 K). The proton transfer reactions between POH+ and NH3 is found to be efficient with rate constants in the range of 1.1–2.7 × 10⁻⁹ cm3 s−1 molecule−1.
Conclusions. The reaction of P+ with water should be considered in astrochemical models in which phosphorus can be released in the gas phase as a cation, from the energetic processing of icy interstellar grains due to shocks. The reaction leads to POH+ as the main reaction product and relevant interstellar isomer, an important precursor for PO formation not only via dissociative recombination with electrons, but also by proton transfer to NH3. The direct formation of PO+ as a secondary channel can explain the high PO+/PO ratio detected in the ISM.
Key words: astrochemistry / molecular data / molecular processes / methods: laboratory: molecular / ISM: abundances / ISM: molecules
M. Michielan and L. Mancini contributed equally to the present work
© The Authors 2026
 Open Access article, published by EDP Sciences, under the terms of the Creative Commons Attribution License (https://creativecommons.org/licenses/by/4.0), which permits unrestricted use, distribution, and reproduction in any medium, provided the original work is properly cited.
This article is published in open access under the Subscribe to Open model. This email address is being protected from spambots. You need JavaScript enabled to view it. to support open access publication.
1 Introduction
The interstellar relative abundance of P with respect to hydrogen is ∼3 × 10⁻⁷, as derived from the present-day solar photosphere (Asplund et al. 2009). However, the main reservoir of interstellar phosphorus in cold clouds and star-forming regions is still unknown. Elemental phosphorus has been mapped in the interstellar medium (ISM) through the ultraviolet features of its ionised form P+ (PII). Early measurements by Jura & York (1978) and Jenkins et al. (1986) indicated a depletion in the diffuse ISM by a factor of 2–3 relative to the solar value. Dufton et al. (1986) and, more recently, Ritchey et al. (2023) suggested that phosphorus is undepleted in the warm diffuse ISM, while it is depleted by a factor of three in denser clouds. However, it is not yet known whether the depletion is associated with volatile species condensed onto the icy mantles of interstellar dust particles or with a refractory form in the core of dust particles.
Only a few P-bearing molecules have been identified so far, mostly in star-forming regions and in the circumstellar envelopes of evolved stars (for a recent review, see Fontani (2024)). Despite their paucity, their detection in extraterrestrial environments, including the coma of the 67/P comet (Altwegg et al. 2016; Rivilla et al. 2020) and extragalactic sources (Haasler et al. 2022), has drawn remarkable attention for its astrobiological implications, given that P is one of the elements necessary for life as we know it. In particular, P-bearing groups such as phosphates  are essential in the formation of biomolecules such as deoxyribonucleic acid (DNA) and ribonucleic acid (RNA), adenosine triphosphate (ATP), and phospholipids. Therefore, in a broader context, the detection of P-bearing molecules across various environments of the ISM offers valuable insights into its prebiotic chemistry, as these molecules may have been delivered to early Earth from extraterrestrial sources via asteroids and/or comets. The recent discovery of hydrated ammonium–magnesium–phosphorus-rich grains in the Ryugu samples (Pilorget et al. 2024) and of hydrated Mg,Na-phosphates in Bennu’s regolith (Lauretta et al. 2024) offers a hint at a possible route of formation of P-bearing organo-compounds that overcomes the problems associated with the phosphorylation mechanism of the more common apatite. In this context, it should be noted that the oxidation of minerals with reduced phosphorus such as schreibersite (also abundant in meteorites, see Pasek (2017)) provides a mechanistic explanation for phosphorylation processes, as has recently been demonstrated by Pantaleone et al. (2024, 2025).
Among the few P-containing molecules, PN and PO have been detected in numerous samples of high-mass (mostly) and low-mass (less frequently) star-forming regions at different evolutionary stages (Turner & Bally 1987; Ziurys 1987; Rivilla et al. 2016; Fontani et al. 2016; Lefloch et al. 2016; Mininni et al. 2018; Rivilla et al. 2018; Fontani et al. 2019; Bergner et al. 2019; Chantzos et al. 2020; Rivilla et al. 2020; Bernal et al. 2021; Bergner et al. 2022; Haasler et al. 2022; Wurmser & Bergner 2022; Fontani et al. 2024; Lefloch et al. 2024; Scibelli et al. 2025) as well as in the circumstellar envelopes of asymptotic giant branch (AGB) and red supergiant (RSG) stars (Tenenbaum et al. 2007; De Beck et al. 2013; Wallstrom et al. 2024; Ravi et al. 2024; Ziurys et al. 2018). The star-forming regions where PO and PN were observed are regions subject to shock waves. This supports the idea that the main carrier of phosphorus is present in interstellar dust grains or their icy mantles, and that the phosphorus is returned to the gas phase by the action of shock waves. More recently, PO and PN have also been detected in the protoplanetary disc HD 100546 by Kama et al. (2025). Also in this case, the main conclusion of the authors is that the phosphorus main carrier must be a refractory reservoir with a sublimation temperature consistent with minerals such as apatite or schreibersite, or with ammonium phosphate salts. Phosphine (PH3), another key molecule in phosphorus chemistry, has been observed only towards the carbon-rich star IRC+10216 (Agundez et al. 2014), and all the searches for it in star-forming regions so far have failed. Other species such as CP, CCP, and HCP have been detected only in the C-rich circumstellar envelopes of evolved stars (Milam et al. 2008; Halfen et al. 2008; Agundez et al. 2007).
Since the detection of PN, some astrochemical models have focused on the production of phosphorus molecules (Thorne et al. 1984; Adams et al. 1990; Millar 1991; Charnley & Millar 1994; MacKay & Charnley 2001; Rivilla et al. 2016; Jimenez-Serra et al. 2018; Chantzos et al. 2020; Garcia de la Concepcion et al. 2021; Sil et al. 2021). In early models, ion-molecule reactions were considered the main formation routes, whereas reactions between neutrals have gradually become more important in recent models. However, the recent detection of PO+ towards the Galactic centre molecular cloud G+0.693–0.027 (Rivilla et al. 2022) has brought attention back to the ion chemistry of phosphorus. Remarkably, PO+ has also been observed (although only via a single transition) towards a low-mass shocked starless core (Scibelli et al. 2025). The relative abundance of PO+ with respect to PO, as reported by Rivilla et al. (2022), is surprisingly high, as is indicated by the comparison with the relative abundance of NO+ versus NO and SO+ versus SO. This might indicate that ion chemistry plays an important role in the case of phosphorus species. The PO+ formation mechanism proposed by Rivilla et al. (2022) starts from the release of PH3 into the gas phase by the sputtering of the icy mantles. PH3 is quickly converted into atomic phosphorus, which is then ionised by cosmic rays. The ion-molecule reactions
 (1)
(1)
 (2)
(2)
convert P+ into PO+. They also include the cosmic-ray ionisation of neutral PO as an additional formation mechanism, even though no laboratory or theoretical data are available on its rate. Qin et al. (2023) have recently evaluated the radiative association rate coefficients for the reaction
 (3)
(3)
The calculated value of (4–8) × 10−17 cm3 s−1, largely independent of temperature in the range 1–104 K, is probably too small for this process to be significant and remains to be tested in astrochemical models.
Given the ubiquitous presence of water in the ISM, the reaction of P+ with H2O can also contribute to the formation of PO+, as well as POH+ (Thorne et al. 1984), according to
 (4)
(4)
 (5)
(5)
The P+ + H2O reaction has previously been studied using ion cyclotron resonance (ICR) mass spectrometry (Thorne et al. 1983) and selected ion flow tube (SIFT) techniques (Smith et al. 1989; Adams et al. 1990). Similar results were obtained with a total rate coefficient of 5.5 × 10⁻¹⁰ cm3 s−1 molecule−1 at 300 K and 90–93% of the reactive flux producing POH+ + H and the remaining 7–10% producing PO+ + H2 one. These values are included in the UMIST database for Astrochemistry (Millar et al. 2024), while the Kinetic database for astrochemistry (KIDA) (Wakelam et al. 2015; Wakelam et al. 2024) indicates values that deviate from the experimental ones, with a total rate coefficient of 2.62 × 10⁻⁹ cm3 s−1 molecule−1 at 300 K and a BR of 50% for both channels (4) and (5). The temperature dependence of the rate coefficient was included as predicted by a standard capture theory model detailed in Wakelam et al. (2010). These kinds of models, however, may be inadequate to describe the reaction rate, since they do not take into account stereodynamical effects that can play an important role as recently demonstrated for the reaction Si+ + H2S (Michielan et al. 2025). In early studies, the product of reaction (5) was indicated as HPO+. Quantum calculations revealed, instead, that PO is an oxygen base rather than a phosphorus base, and the lowest energy protonated PO isomer is POH+, while the phosphorus- protonated species HPO+ is 1.20–1.24 eV higher in energy (Esseffar et al. 1993, 1994; Filippi et al. 1997). In UMIST and KIDA, it is still indicated as HPO+.
In this work, we present a new experimental determination of the total reactive cross-sections (CSs) and BRs for the reaction of P++ H2O as a function of the collision energy in the 0.1–3 eV range from which the rate coefficients as a function of the temperature in the 10–5000 K range have been inferred. We have used perdeuterated water, D2O, for technical reasons. The measurements were performed using the guided ion beam (GIB) technique, in which bimolecular reactions can be investigated at a much lower pressure, avoiding the effect of multiple collisions that were instead present in previous experiments (multiple collisions may artificially increase the lifetimes of reaction intermediates, thereby affecting the measured rate coefficients, and alter the nature of the products through secondary collisions).
Complementary theoretical calculations of the reactive potential energy surface (PES) were carried out at the coupled-cluster level of theory (CCSD(T)) for both isotopic variants P++ H2O and P++ D2O. Since there could be an interference from the reaction involving the first electronically excited state 1D of P+ and, also, intersystem crossing (ISC) from the ground triplet to the underlying singlet PES is possible, we also derived the PES associated with the P+(1D) + H2O reaction. A statistical RRKM analysis was conducted to obtain the product BRs as a function of temperature. In addition, we propose possible routes leading to neutral PO from POH+ and PO conversion into PN, by calculating the PES for i) the proton transfer reaction between the POH+ cation and NH3 and ii) the N + PO reaction leading, adiabatically on a triplet PES, to PN + O.
2 Experimental methods
Data, in terms of absolute CSs and BRs, on the reaction P+ + D2O were collected using the GEMINI (Gas-phase Experiment for Measurements on Ion-Neutral Interactions) set-up at the University of Trento (Ascenzi et al. 2007; Franceschi et al. 2007; Richardson et al. 2022; Mancini et al. 2024a). It is a GIB tandem mass spectrometer composed of two octopoles (O) and two quadrupole mass filters (Q) in a O–Q–O–Q configuration that allows for the investigation of bimolecular reactions of mass-selected ions.
2.1 Production of the ion beam
P+ ions were produced in the ion source by electron ionisation of a gaseous mixture, at a pressure in the 10−7–10−6 mbar range, of PCl3, D2, and N2 (in a concentration of 5%, 45%, and 50%, respectively) at electron energies of 53–55 eV, with electrons emitted by a tungsten filament. The dilution of PCl3 with D2 and N2 was carried out to ensure that we detected the outcomes of the P+ reactions in its 3P electronic ground state. P+ has two low-lying metastable excited states, 1D2 and 1S0, located 1.10 and 2.67 eV above the ground state, respectively (Kramida et al. 2024). The 1D2 state has a radiative lifetime (for its decay into the ground state via a spin-forbidden transition) of the order of tens of seconds (∼8 s according to the calculations by Huang (1985), ∼43 s according to Czyzak & Krueger (1963)). The 1S0 state has a total lifetime of ∼0.46 s for its decay to the lower-lying states (Czyzak & Krueger 1963; Nahar & Shafique 2025). Hence, both metastable states, if generated in our ion source, have sufficiently long lifetimes to be transported into the scattering cell and contribute to the recorded signals. The purpose of D2 and N2 is to scavenge excited P+ in the beam: (1) N2 acts as an efficient collisional quencher; (2) D2 behaves as a reactive quencher of the excited states. Its reaction with P+(3P) and P+(1D2) are both endothermic (by 1.27 and 0.17 eV, respectively), while the reaction with P+(1S0) is exothermic by 1.41 eV (Alonso de la Fuente et al. 2026). Using this mixture, we have experimental evidence that the quenching of excited states is efficient enough to obtain a parent ion beam that essentially contains P+(3P). The evidence was obtained by performing additional experiments on the reactivity of P+ with N2 using the GEMINI set-up and a similar GIB apparatus installed at the DESIRS VUV beamline of the SOLEIL synchrotron radiation facility, where P+ is produced by dissociative photoionisation of PCl3 and is formed exclusively in its ground state. Further details on the excited state quenching and the experiments with N2 are presented in Appendix A.
2.2 Determination of absolute cross-sections as a function of the collision energy
The P+ ions passed through the first octopole, which acted as an ion guide, before being mass-selected by the first quadrupole. Reactions occurred in the second octopole, which is surrounded by a scattering cell. Absolute CSs as a function of the collision energy (ECM) for the various product channels were determined from the measured transmitted intensities of product and reactant ions, together with the partial pressure of the neutral reactant in the scattering cell. The experimental total reactive CS was then obtained as the sum of the CSs associated with each product channel. The effective cell length (11.4 ± 4.0 cm), necessary to determine the absolute CSs, was obtained by calibration experiments on the Ar•+ + D2 system (Ervin & Armentrout 1985), as detailed in Michielan et al. (2025).
The pressure of the gas in the scattering cell was monitored by a spinning rotor gauge (SRG2 MKS Instruments, MA, USA). In present experiments the scattering cell is filled with D2O in a mixture with Ar (concentration of D2O ∼5%) at total pressures in the range 10−6–10−5 mbar (number density of 1010–1011 molecules cm−3) and the dilution factor was accordingly taken into account to determine the absolute CS. The pressure range and the mixture with Ar minimise secondary reactions with D2O, while enabling measurement of CSs in a dynamic range from 10−1 to 102 Å2. Data were collected over one month with an uncertainty of ∼30%. Collision energies in the laboratory frame, set by the +1 ion charge and source–cell voltage difference, were calibrated via the retarding potential method (Teloy & Gerlich 1974), giving an ion beam full width at half maximum (FWHM) of ∼0.2–0.3 eV in the centre-of-mass (CM) frame. By tuning the octopole and optics voltages, the collision energy in the CM frame, ECM, was varied from ∼0.1 to 3 eV.
3 Theoretical methods
3.1 Electronic structure calculations of the potential energy surfaces
The PESs for the reactions of P+ + H2O and D2O were characterised by adopting a computational strategy previously used for other systems (Rosi et al. 2019; Liang et al. 2023b; Mancini et al. 2023; Pannacci et al. 2023; Di Genova et al. 2025). A first analysis of the PES was performed through density functional theory calculations, with the hybrid functional B3LYP (Becke 1993; Stephens et al. 1994) in conjunction with the correlation consistent valence polarised set aug-cc-pV(T+d)Z (Dunning Jr 1989; Kendall et al. 1992; Woon & Dunning Jr 1993) to locate the relevant stationary points. Harmonic vibrational frequencies were computed at the same level of theory to check on the nature of each stationary point (a minimum if all the frequencies are real or a saddle point if one of the frequencies is imaginary). The assignment of the identified transition states was performed through intrinsic reaction co-ordinate (IRC) calculations (Gonzalez & Schlegel 1989, 1990). Subsequently, the more accurate coupled cluster theory, including single and double excitations, as well as a perturbative estimate of connected triples CCSD(T) (Bartlett 1981; Raghavachari et al. 1989; Olsen et al. 1996), with the same basis set aug-cc-pV(T+d)Z, was used to obtain more accurate energy values. The zero-point energy (ZPE) correction, evaluated at the B3LYP level, was added to all calculations. All possible reaction pathways were explored at this level of calculations. For the lower-energy pathways leading to exothermic channels, we further extended the level of calculations by using the CCSD(T) level corrected with a density-fitted (DF) MP2 extrapolation to the complete basis set (CBS) and with corrections for core electron excitations. Further details on the computational procedure can be found in Michielan et al. (2025) and Di Genova et al. (2025), in which the same methodology was applied.
Since the accuracy of our best-computed value should not be better than the ‘chemical accuracy’ of 1 kcal mol−1, we rounded all the reported energies to 1 kJ mol−1. All calculations were performed using GAUSSIAN09 (Frisch et al. 2009) and Molpro (Werner et al. 2020), while the analysis of vibrational frequencies was carried out using Avogadro (Hanwell et al. 2012).
3.2 Kinetics calculations
As previously done in Mancini et al. (2021), Vanuzzo et al. (2022a) and Mancini et al. (2024b), the values of the BRs were obtained using Rice–Ramsperger–Kassel–Marcus (RRKM) calculations. The microcanonical rate coefficient, k(ϵ), of each unimolecular process at a fixed total energy, ϵ, was evaluated according to
 (6)
(6)
where N(ϵ) represents the number of states of the transition state at an energy ϵ, ρ(ϵ) represents the reactant density of states at the same energy, and h is Planck’s constant. Finally, when no clear transition state was present, variational transition state theory (Klippenstein 1992) was used. A Markov (stochastic) matrix is set, including the results of the unimolecular calculations for all reaction pathways (Balucani et al. 2009, 2012; Vanuzzo et al. 2022b; Balucani et al. 2023). The matrix was subsequently raised to a sufficiently high power to achieve convergence, allowing us to derive the BRs and rate constants for all product channels over the desired temperature range. Experimental CSs were also compared with the results of traditional capture (Langevin and averaged dipole orientation) models, which are often used to evaluate unknown reaction rate coefficients of interest.
4 Results
4.1 Experimental reactive cross-sections and branching ratios
Product ions from the P+ + D2O reaction have been identified at m/z 49 (POD+/DPO+) and 47 (PO+). An additional signal at m/z 22 is associated with D3O+, the product of the secondary collisions between POD+ and D2O, resulting in a D+ transfer reaction. The effect of secondary reaction can be strongly reduced by using the diluted D2O/Ar mix in the scattering cell, but it cannot be completely eliminated due to the reaction of POH+ with H2O, having a rate constant at 300 K equal to 3.4(±20%) × 10−10 cm3 s−1, as indirectly determined by Filippi et al. (1997). In their study of the reaction between PF+ and H2O, which produces POH+ and HF as primary products, the authors observed the formation of H3O+ even at their lowest operating pressures of ∼1.3 × 10⁻⁷ mbar. Assuming that there is no significant change in the rate constant upon substituting H2O with D2O, the complete suppression of the secondary ion at m/z 22 is not achievable in our GIB set-up. The m/z 49 ion yield is then corrected by adding the signal recorded at m/z 22. A summary of the possible reaction pathways for the reaction of P+ with water, and associated energetics is reported in Table 1, where the energy values refer to the reaction with H2O.
Absolute CSs for the reaction channels measured as a function of ECM are shown in Fig. 1, where data for the m/z 49 ion (filled red circles) include the above-mentioned correction for secondary reactions. For both products we observe a decrease in CS as ECM increases (with values in the range from 0.3 to 50 Å2).
The experimental total reactive CS was compared to the CS calculated according to the Langevin and the average dipole orientation (ADO) capture models (Bass et al. 1975; Su et al. 1978), as shown in Fig. 2. A good match is observed between the shape and values of the experimental CS and Langevin’s model throughout the measured collision energy range, with major differences towards ECM = 2–3 eV. Larger discrepancies are observed from the comparison with the ADO model. The latter indeed grows quicker as the collision energy decreases and maintains higher CS values across the entire collision energy range. Similar differences can be noted after converting the CSs(ECM) into rate constants, k(T). A more detailed interpretation is presented in Sect. 8.
The experimental BRs are 90(±2)% for the main channel leading to POD+/DPO+, and 10(±4)% for PO+. These values are constant over the explored collision energy range, as visible in Fig. 1 (see also Fig. B.1 of Appendix B showing the BRs versus collision energy).
 |
Fig. 1 Experimental CS for the reaction channels as a function of the collision energy, ECM. The solid red circles are the absolute CSs for the main channel at m/z 49 (POD+/DPO+), while the solid black squares refer to the PO+ product, at m/z 47. |
4.2 From experimental CSs to rate constants
As a result of the ion energy distribution, the experimental total CS as a function of the ion energy (hereafter denoted as effective CS, σeff (ECM)) differs from the true CS as a function of the relative collision energy, here denoted as σ(E). As the direct deconvolution of σeff (ECM) does not result in a unique form for σ(E), the function representing the true CS needs to be inferred. The deconvolution procedure adopted has been described in detail in Michielan et al. (2025). Here, the functional form of σ(E) is
 (7)
(7)
where σ0 is an energy-independent scaling factor, n is the parameter controlling the power-like part of the function, and E′, E″ are parameters that allow for fine adjustments of the fitting function in the high collision energy range. Such a form follows the work by Ervin & Armentrout (1985), with the introduction of a Fermi-Dirac function as a factor to reproduce the experimental trend at high collision energies. The cross section (fitting function) is represented in Fig. 2 as the filled blue circles, where the guess for the true CS function is also reported (black triangles) together with the experimental total CSs (orange stars). According to the proposed model for the true CS, σ(E), and in agreement with the experimental observation, the CS sharply decreases and eventually falls below our detection sensitivity at high ECM values. This behaviour is attributed to the shortening of the collision time as ECM increases, making electronic rearrangement not fast enough for the reaction to proceed. Conversely, as ECM decreases, the system tends to access more reactive configurations. From the shape of the CS, we can conclude that no barrier is present, at least in the considered energy range. Hence, the modeled CS includes no threshold energy and no stereodynamical effects. However, appreciable stereodynamical effects could emerge at ECM much lower than 0.1 eV, due to the increased selective role of anisotropic long-range forces on the collision dynamics (see Sections 6 and 8).
After extrapolating the true CS, rate constants, k, as a function of temperature, T, were obtained by averaging the true CS on the Maxwell-Boltzmann distribution, as described in Michielan et al. (2025). Using such an approach, we obtained  cm3 s−1 molecule−1 at 300 K, which is in agreement with the experimental value reported by Thorne et al. (1983), Smith et al. (1989) and Adams et al. (1990). The difference between the extrapolated rate constant and the previously measured rate constants is, in fact, within our experimental error bars (∼30%). The best fit of σeff (ECM) was obtained with the following parameters: σ0 = 19.942 Å2, n = −0.57, E′ = 2.776 eV, and E″ = 1.005 eV. A comparison between the rate constant as a function of temperature extrapolated from the experimental CSs and those relative to Langevin, ADO, and Su-Chesnavich models is reported in Fig. 3 and is discussed in Sect. 8.
Reaction energies (∆E) for the identified products coming from the reaction of P+ with H2O.
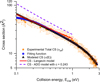 |
Fig. 2 CSs for the reaction of P+ with D2O as a function of collision energy, ECM. The orange-filled stars are the experimental total CS, the red line is the CSs as estimated from the Langevin model, and the dashed violet curve is the CSs according to the ADO model. The black-filled triangles and the blue-filled circles come from our fitted model to extract the true CS from the experimental data: the blue circles represent the fitting function, while the black filled triangles represent the form of the true CS extracted as a result of the fitting procedure. Further details are discussed in Sect. 4.2. |
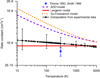 |
Fig. 3 Rate constants as a function of temperature. The extrapolation obtained from the experimental data is given by the filled black circles. Langevin model is represented by the red line, while the Su-Chesnavich and ADO models are represented in orange and violet, respectively. The rate constant value, measured with H2O (Smith et al. 1989; Thorne et al. 1983) is reported as a blue square. |
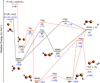 |
Fig. 4 Schematic representation of PES obtained for the P+ + H2O (data in black) and for the P+(3P) + D2O (data in blue in square brackets) reactions. All the reported energies were evaluated at the CCSD(T)/CBS//B3LYP/aug-cc-pV(T+d)Z level of theory. Black lines indicate the triplet PES correlating with P+(3P), while red lines represents the singlet PES correlating with P+(1D). |
5 Theoretical results
5.1 The potential energy surfaces
We calculated the PESs for the reactions of both the ground and first excited states of P+; that is, P+(3P) + H2O and P+(1D) + H2O. Since isotopic substitution does not alter the electronic structure and energy, the stationary points on the PES are the same for the two isotopic variants involving H2O or D2O. However, the ZPE is different for the two cases. The simplified schemes (showing only the low-energy pathways to the two exothermic channels) of the PESs obtained for the P+(3P) + H2O and P+(1D) + H2O reactions are shown in Fig. 4. In the figure, the energy values reported in black refer to the ZPE-corrected values for the H2O reaction, while the ZPE-corrected values for the reaction with perdeuterated water are shown in blue in square brackets. The red lines indicate the triplet PES, while the blue lines indicate the singlet PES. For the sake of simplicity, only the most accurate CBS energy values are shown. In Appendix C the full PESs, including the other endothermic channels, derived at the CCSD(T)//B3LYP/aug-cc-pV(T+d)Z level of calculations are reported.
5.1.1 The triplet potential energy surface
The first step of the P+(3P) + H2O [D2O] reaction is the barrierless formation of an adduct, 3MIN1, located 257 [258] kJ mol−1 below the energy of the reactants. By overcoming a barrier of 238 [245] kJ mol−1 (3TS2), 3MIN1 can directly undergo an O-H bond fission, leading to the POH+ + H products. The enthalpy change for this channel is –67 [–60] kJ mol−1. Alternatively, 3MIN1 can isomerise to 3MIN2 via H-migration through a barrier (3TS1) of 177 [182] kJ mol−1. This intermediate, located 202 [199] kJ mol−1 below the reactant energy asymptote, can also undergo an O–H bond fission forming the POH+ cation in a barrierless channel. All the other possible channels, including those leading to HPO+ + H and PH+ + OH, are strongly endothermic (see Appendix C). Furthermore, the adiabatic triplet PES can only lead to the formation of the PO+ cation in its first electronically excited (3Σ) state. For this reason, the adiabatic channel leading to 3PO+ + H2 is endothermic by 197 kJ mol−1 (at the CCSD(T)/aug-cc-pV(T+d) level of calculations) and is not open under the low temperatures typical of star-forming regions. PO+ in its ground electronic state can only be formed if ISC to the underlying singlet PES occurs. In conclusion, the reaction occurring adiabatically on the triplet PES can only form the products POH+ + H.
The PES we derived is only in qualitative agreement with the PES obtained in previous calculations by Largo et al. (1991), who used a lower computational level and a less accurate basis set. Therefore, although the relevant stationary point structures are the same in the two PESs, the energy values differ significantly. For example, 3TS2 was located at +7.7 kcal mol−1 (+32 kJ mol−1), making this pathway inaccessible at the low temperatures of interest. Furthermore, the TS1 transition state is much higher in energy, and the enthalpy change is also quite different for the only open channel (–43 vs. –67 kJ mol−1). Fur thermore, considering that the channel leading to PO+ in its excited triplet electronic state is endothermic, Largo et al. (1991) concluded that this channel is thermodynamically inaccessible. However, in a system containing a third-row element, such as phosphorus, spin-orbit coupling is strong, making ISC to the underlying singlet PES efficient and the formation of PO+ in its ground state possible.
5.1.2 The singlet potential energy surface
We used the experimental singlet–triplet energy gap (106 kJ mol−1) (Kramida et al. 2024) in our calculations. Note that the energy values in Fig. 4 all refer to the P+(3P) + H2O energy asymptote taken as the zero of the energy scale. The first minimum identified in the singlet PES (1MIN1) lies 176 [179] kJ mol−1 below the energy of the triplet reactants (that is, 282 [285] kJ mol−1 below the energy of the singlet reactants) and, as in the case of the triplet PES, is characterised by the interaction of the P+ cation with the oxygen atom of the water molecule. In these adducts, the interaction between phosphorus and oxygen is primarily electrostatic, with comparable strength in the triplet and singlet states. Consequently, the energy difference between 3MIN1 and 1MIN1 reflects the energy separation between P+(3P) and P+(1D). A different situation arises in the MIN2 minima, where the P atom is covalently bonded to oxygen and hydrogen. In this case, there is a significant difference in energy between the ground singlet state and the triplet excited one. Upon its formation, 1MIN1 can undergo direct O–H bond fission via the transition state 1TS2, leading to the formation of POH+ + H. This pathway involves an energy barrier of 154 [162] kJ mol−1 and results in a global enthalpy change of –67 [–60] kJ mol−1 (the enthalpy change with respect to the P+(1D) + H2O energy level is –173 [–166] kJ mol−1). Alternatively, 1MIN1 can isomerise to 1MIN2 through hydrogen migration, which entails overcoming a barrier (1TS1) of 112 [122] kJ mol−1. 1MIN2 can directly undergo a P−H bond fission, forming again the POH+ cation, in a barrierless process. Alternatively, the rotation around the P–O axes, via a small barrier of 36 [39] kJ mol−1 (1TS4), leads to the formation of the 1MIN4 intermediate, located 384 [383] kJ mol−1 below the reactant energy asymptote. 1MIN4 which can also undergo a barrierless P–H bond fission with the formation of the POH+ cation. Additionally, a four-centre H2-elimination can take place, overcoming a barrier (1TS5) of 249 [254] kJ mol−1 and leading to the PO+ + H2 products, the most exothermic channel of the PES, with an global enthalpy change of 315 [308] kJ mol−1 (the enthalpy change with respect to the to the P+(1D) + H2O energy level is –421 kJ mol−1).
A subsequent H-migration from 1MIN2 can lead to the formation of 1MIN3 (see Fig. C.2 in Appendix C where the full PES, evaluated at the CCSD(T)/aug-cc-pV(T+d)Z//B3LYP/aug-cc-pV(T+d)Z level of theory, is reported), in which both hydrogen atoms are bonded to the P atom. 1MIN3 can further evolve to form HPO+ + H. In the case of the singlet PES, this is an exothermic channel (∆H0 = –79 kJ mol−1 at the CCSD(T)/aug-cc-pV(T+d)Z level of theory). 1MIN3 can also dissociate into PO+ + H2 in a three-centre H2-elimination channel that is characterised by a very high-energy barrier (+311 kJ mol−1) as expected for a mechanism of this kind.
Branching ratios (BR%) for the reactions with H2O/D2O at different temperatures from RRKM calculations.
5.2 RRKM branching ratios
On the triplet PES, only a single exothermic product channel is open (POH+ + H); therefore, there is no need to perform RRKM calculations of product BR. The singlet PES, which correlates with P+ in its first excited state 1D, but can also be accessed from the triplet PES via ISC, is characterised by three open reaction channels of which only two are energetically accessible when starting from the triplet PES: the POH+ + H channel, also open on the adiabatic triplet surface, and PO+ + H2. Since the experimental data exclude a contribution from the P+(1D) reaction, our RRKM calculations on the singlet PES are specifically aimed at evaluating the extent of ISC from the initially populated triplet entrance channel, following the same approach successfully adopted in previous cases – see, for instance, Liang et al. (2023a) and Pannacci et al. (2023). Accordingly, the internal energy of the 1MIN1 intermediate is referenced to the P+(3P) + H2O / D2O energy asymptote, excluding the additional energy associated with direct population of the excited singlet reactant state. Considering that only a small fraction of the reactive flux on the singlet PES accessed from the triplet one produces POH+ rather than PO+, and since the latter can only be formed after ISC, we can derive the extent of ISC, EXTISC, via the following equation:
 (8)
(8)
where  is equal to the experimental yield of 10% in the entire T range investigated, while for
  we can consider the BRs of Table 2. Therefore, EXTISC varies from the smallest value of 10.3% at 10 K up to largest value of 11.9% at 1000 K for the P+ + D2O reaction.
Unimolecular rate constants as a function of the total energy (ϵ) for the various relevant steps are shown in Fig. B.2. From them, the BRs over a temperature range from 10 to 1000 K were obtained (Table 2). This range includes both the temperatures typical of star-forming regions and, at least in part, those of the CSEs of AGB stars. For all conditions, the dominant channel is that leading to PO+ + H2, with a BR ranging from ∼96% (at low T) to ∼86% (at high T), while the POH+ + H channel contributes from 4% at 10 K up to ∼14% at 1000 K. These results can be rationalised by examining the PES topology (Fig. 4). Once formed, 1MIN1 can either dissociate into POH+ + H or isomerise to 1MIN2. The much lower energy of 1TS1 with regard to 1TS2 favours the isomerisation (see Fig. B.2). The conversion of 1MIN2 into its cis isomer 1MIN4 (and vice versa) is very fast. Both 1MIN2 and 1MIN4 can dissociate into the POH+ + H products, but the H2 elimination from 1MIN4 largely dominates. As clearly visible from Fig. B.2, the H2 elimination from 1MIN4 is faster than the H-loss from 1MIN4 for small values of ϵ (up to 40 kJ mol−1) corresponding to the low T values of relevance for star-forming regions.
As has already been mentioned, deuteration does not significantly affect the energetics of the stationary points on the PES. Consequently, the BRs for the reaction of P+(1D) with H2O and D2O are very similar, with minor differences likely attributable to slight variations in energy and/or in the values of harmonic vibrational frequencies.
 |
Fig. 5 Schematic representation of PES obtained for the POH+ + NH3 reaction. All the reported energies were evaluated at the CCSD(T)/CBS//B3LYP/aug-cc-pV(T+d)Z level of theory. |
6 The reaction POH+ + NH3
Since the major product of the reaction P+(3P) + H2O is POH+, we calculated the PES and rate constant for the proton transfer reaction to ammonia as a possible route to neutralise POH+ (Taquet et al. 2016) in addition to dissociative recombination with electrons. Given the strength of the P–O bond (617 kJ mol−1), the proton transfer will leave the P–O bond intact, providing a viable means of converting the POH+ ion to the more widely observed PO. Following the approach previously used for similar systems (Skouteris et al. 2019; Michielan et al. 2025; Di Genova et al. 2025), we derived the PES at the CCSD(T)/CBS//B3LYP/aug-cc-pV(T+d)Z level of theory (see Fig. 5).
The reaction is exothermic by 157 kJ mol−1 (that is, much less than the P-O bond energy) and proceeds via the barrierless formation of an intermediate (MIN1PT), located 237 kJ mol−1 below the reactants. Since the intermediate can form the PO and  products directly in a very exothermic channel, back-dissociation is expected to be negligible.
For the proton transfer reaction between POH+ and NH3, no experimental k(T) data are currently available. However, Penning ionisation experiments on ammonia (Falcinelli et al. 2016b), triggered by electron transfer, indicate that elementary processes promoted by the molecular lone pairs – aligned along the C3v symmetry axis of ammonia – occur within a defined angular acceptance cone. Such a cone is expected to be relevant also for proton transfer, as it defines the spatial region where the permanent electric dipole of NH3 enhances its attractive interaction with an approaching cation. Accordingly, we estimated the long-range attraction coefficients –  and
and  , accounting for ion–induced dipole plus dispersion and ion–induced dipole plus dispersion plus temperature-averaged (T ∼ 300 K) ion–permanent dipole interactions, respectively – obtaining values of 19.1 and 122 eV·Å6. The capture model treatment using these coefficients yields rate constants of 1.1 × 10⁻⁹ and 2.7 × 10⁻⁹ cm3 s−1 molecule−1, which can be regarded as lower and upper bounds. These values are in reasonable agreement with rate coefficients measured at 300 K for many ion–molecule reactions involving exothermic proton transfer with ammonia (Hemsworth et al. 1974). At very low temperatures, additional stereodynamical constraints may become relevant. Given the charge distribution on POH+ (+1 on P, -0.3 on O, and +0.3 on H), it is expected that, as the temperature decreases, the anisotropy of long-range electrostatic interactions favours the most attractive, but non-reactive, configuration, HOP+–NH3, rather than the configuration in which the O–H bond is aligned towards the ammonia lone pair (see MIN1PT in Fig. 5), which promotes proton transfer.
7 The reaction N + PO
The reaction between PO and atomic nitrogen has previously been investigated by Douglas et al. (2022), who used a theoretical method similar to ours, and by Souza et al. (2021), who used a multi-reference approach and considered the two lowest 3A′ and 3A″ PESs. The schematic representation of the PES leading to O + PN is shown in Fig. 6, with energies computed at the CCSD(T)/CBS//B3LYP/aug-cc-pV(T+d)Z level of theory. A complete representation of the PES in which high-energy pathways to P + NO are also shown, obtained at CCSD(T)/aug-cc-pV(T+d)Z//B3LYP/aug-cc- pV(T+d)Z level of theory, is provided in Appendix E, Fig. E.1.
The reaction starts with the barrierless attack of atomic nitrogen to the P side of PO, forming the intermediate MIN1c, located 216 kJ mol−1 below the reactants. From this intermediate, the reaction proceeds via O-elimination, with the O atom continuing to weakly interact with the newly formed PN fragment on the nitrogen side, yielding the van der Waals intermediate MIN2c (–13 kJ mol−1 with regard to the reactants energy asymptote). The associated transition state (TS1c, located 10 kJ mol−1 below the reactants) clearly indicates the cleavage of the P–O bond and the transfer of the O atom towards the N-side of the adduct. Subsequent dissociation of MIN2c produces PN plus O(3P), with an overall enthalpy change of –9 kJ mol−1.
Our results are consistent with those of previous theoretical work (Souza et al. 2021; Douglas et al. 2022), although they were obtained using different computational methodologies. Small discrepancies between the energy values arise from the different levels of theory and basis sets adopted. It is to be noted that, when using the less accurate CCSD(T)/aug-cc-pV(T+d)Z//B3LYP/aug-cc-pV(T+d)Z level of theory, TS1c lies at an energy value that is slightly above the energy of the reactants (+1 kJ mol−1, see Fig. E.1 of Appendix E). Also, the enthalpy change is slightly less negative (–4 kJ mol−1). Being so close to 0, the energy value of TS1c must be treated with the greatest accuracy possible. We cannot compare our value of TS1c with that by Souza et al. (2021), since their energy value does not include the ZPE, or with that by Douglas et al. (2022), since only a plot is reported in the SI and the numerical values are not given.
We have not calculated the rate coefficient and product BR, since the work by Souza et al. (2021) revealed a complex intertwining of the two PESs of the low-energy electronic states, with the presence of a conical intersection along the pathway leading to the P + NO products. The kinetics of this reaction require a more sophisticated treatment. However, given the high energy value of the exit transition state, a rate coefficient of the order of 10−12 cm3 s−1 is plausible for T<300 K, since back-dissociation is expected to play a role. The value suggested by Douglas et al. (2022) for stellar winds is not recommended for star-forming regions, which are at much lower temperatures.
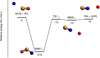 |
Fig. 6 Schematic representation of PES obtained for the PO + N(4S) reaction. All the reported energies were evaluated at the CCSD(T)/CBS//B3LYP/aug-cc-pV(T+d)Z level of theory. |
8 Discussion
The experimental observables in our study of the reaction between P+ and D2O are the absolute reactive CSs and BRs between the two open channels as a function of the collision energy. From the CSs, we deduced the rate constant and – based on a robust model – obtained the rate constants as a function of temperature, k(T), for a wide T range, comprising low values typical of star-forming regions and higher ones relevant for circumstellar envelopes of AGB stars. This extrapolation is realistic because it is based on experimental data for CSs that depend on collision energy.
Our results are consistent with previous studies performed using classical SIFT and ICR techniques, both in terms of the rate constant and the BRs of the two open channels. In our experiment, particular care was taken to assess the possible contribution of electronically excited states of the P+ ion to the reactive signal. A D2/N2 gas mixture was used to quench excited states via inelastic and reactive processes. Furthermore, we verified that data obtained with an independent GIB apparatus – whereby P+ is produced by selective photoionisation exclusively in its ground state – for the P+ + N2 reaction are consistent with those obtained using the same P+ source as in the present work (see Appendix A). These results indicate that there is no significant contribution to the reactive signal from the 1D and 1S states. In SIFT experiments, quenching of all excited states is ensured by the relatively high operating pressures, while in ICR experiments, ions are trapped for variable durations, allowing for relaxation of metastable excited states.
The studies by Smith et al. (1989) and Thorne et al. (1983) provided no indication of the temperature dependence of the rate constant. In contrast, our results show that the reaction efficiency decreases with increasing collision energy, implying a corresponding decrease of the rate constant with increasing temperature. It is worth noting that capture theory predictions available in the literature are widely used to estimate the temperature dependence of k(T) for ion-molecule reactions: i) the Langevin model describes the interaction between a point-charge ion and a polarisable but nonpolar molecule; ii) the ADO model (Bass et al. 1975; Su et al. 1978) accounts for the average orientation of the dipole of the neutral species with respect to the ion, by introducing a scaling parameter, c, which can be estimated from the dipole moment and polarisability of the neutral reaction partner (a value of c = 0.2431 is used for the present system); iii) the Su-Chesnavich parametrisation combines a central field model with simplified trajectory simulations (Su & Chesnavich 1982; Tsikritea et al. 2022). Such predictions are often used in astrochemical models and databases (Wakelam et al. 2010).
Fig. 2 compares the experimental CSs versus ECM with predictions from capture models, while Fig. 3 shows the corresponding rate constants, k(T), as a function of temperature. Throughout the investigated temperature range (10–5000 K), our data indicate that the Langevin model (solid red lines) is the most realistic. In particular, at T = 300 K the predicted rate agrees, within the combined uncertainties of both prediction and measurement methods, with the experimental data reported by Smith et al. (1989), Adams et al. (1990) and Thorne et al. (1983) (blue square in Fig. 3). Although water has a rather strong permanent dipole moment (1.86 D), the ADO model (dashed purple lines) and the Su-Chesnavich one (dotted orange line in Fig. 3) predict excessively high rate constants and an excessively strong temperature dependence.
Our experimental observations suggest that the growing influence of the dipole moment is counterbalanced by enhanced stereo-dynamical effects, In particular, the selectivity and anisotropy of long-range forces determine an acceptance cone that governs the formation of the precursor state (collision complex), which is wider than the angular cone within which reactive collisions are favoured. In other words, several configurations of the collision complex, while energetically stable, may not be reactive, i.e. they may not lead to formation of 3MIN1. To properly characterise the P+-water interaction, it must be taken into account that, in addition to the permanent dipole moment, water exhibits two relatively large components of the electric quadrupole moment (Θ). Assuming the water molecule to lie in the xy plane, with its C2v axis aligned along y, the components are Θzz = −2.50 D·Å, Θxx = +2.63 D·Å, and Θyy = −0.13 D·Å (Russell 2020). Thus, representing water merely with a three-charge model (a negative partial charge on O and positive partial charges on H), although consistent with the dipole moment, provides an overly simplified description of its electrostatic structure. In the case of Penning ionisation of water with Ne∗, a more articulated charge distribution leads to a wide acceptance cone, which allows the approach of Ne∗ on the O side of water both along the lone pair aligned with the z axis and along the one aligned with the y axis – see Fig. 2 in Falcinelli et al. (2016a). Furthermore, it must be considered that the P+ ion in its ground electronic state 3P is an open-shell species, with two partially filled p orbitals and one vacant p orbital. Consequently, P+ also possesses a quadrupole moment, with a positive component in the direction of the empty orbital and two negative components in the directions of the half-filled orbitals.
These considerations suggest that the reaction cone should be confined to the molecular plane, centred in a direction intermediate between the y and x axes. Within this cone, the ion approaches the water molecule with one half-filled orbital, interacting simultaneously with both the lone pair and the O–H bond. Only within this cone, reactivity is promoted via breaking of the O-H bond and formation of a new bond P-O through the sharing of unpaired electrons, leading to the bent structure of the POH+ product (see Fig. 4).
8.1 Formation of PO+ and the extent of intersystem crossing (ISC)
Our experiments with D2O show POD+ as the dominant products (BR = 90 %), with PO+ as a smaller channel (BR = 10%). This is consistent with previous results of Smith et al. (1989) and Thorne et al. (1983), who reported POH+:PO+ ratios of 90:10 and 93:7, respectively. According to the characteristics of the triplet PES, only the formation of POD+ is instead possible. The production of PO+ can be explained in two ways: i) formation via P+ in its 1D excited state, which favours PO+ as the major product, as suggested by our computational results, or ii) a non-adiabatic pathway through ISC from the triplet PES, correlating with P+(3P) reagent, to the singlet PES correlating with PO+ (singlet) plus H2. To distinguish between these scenarios, we paid great attention to verifying the presence of excited states of phosphorus in our experimental set-up. As has already been mentioned, by referring to the P+ + N2 reaction, we concluded that the amount of P+ in its 1D and 1S state is negligible. Furthermore, the observation that the minor channel BR is consistently around 10% across all studies supports the conclusion that the PO+ + H2 channel originates from the reaction of ground-state P+ via ISC.
Therefore, the BR measured for PO+ (10%) can be used to derive the extent of ISC, since most of the reaction in the singlet PES produces PO+ + H2. A contribution of ISC around 10–11% is consistent with the expected behaviour of reactions involving phosphorus: as a third-period element, P exhibits relatively strong spin–orbit coupling, which enhances the probability of transitions between states of different spin multiplicity and thus facilitates ISC. Accordingly, the observed ISC extent aligns with the general trend that heavier main-group elements undergo spin-forbidden processes more readily than lighter ones.
Parameters for the rate constants of the reaction P+ plus D2O.
8.2 Astrophysical implications
Our study confirms the role of the P+ + H2O reaction in forming protonated PO (∼90%) and the PO+ ion (∼10%). The more stable isomer between HPO+ and POH+ is the latter, as previously suggested by theoretical studies and confirmed by ours. POH+ can be converted into the neutral species PO via electronion recombination or by proton transfer to abundant species with a high proton affinity, such as ammonia. Our study shows that the latter process is efficient. Furthermore, since the exothermicity of the proton transfer reaction is smaller than the bond energy of PO, the proton transfer reaction is certainly non-dissociative. Our study also provides the temperature dependence, k(T), for the title reaction, albeit indirectly through a robust model-based extrapolation of our cross-section data as a function of collision energy. According to our analysis, the rate constant is very close to that predicted by the classical Langevin model, but deviates significantly from the ADO-type models used for this reaction in KIDA. In conclusion, the parameters we suggest for incorporating the two channels into astrochemical models using the following modified Arrhenius equation are reported in Table 3:
 (9)
(9)
where γ = 0 as the reaction is barrierless. The parameters were obtained from the best fit of the total rate constant, extrapolated from experimental data (black dots-solid line in Fig. 3), by separating the temperature values into two subsets. The rate constants for the two channels were obtained by using the experimental BRs.
A significant characteristic of the title reaction, already seen in the experiments by Thorne et al. (1983) and Smith et al. (1989) and confirmed by our study, is that PO+ is a primary product formed with a relative yield of 10% at all the collision energies (and, therefore, temperatures) investigated. Therefore, this reaction can explain, together with reactions (1) and (2), the unusually high abundance of PO+ with respect to PO observed by Rivilla et al. (2022) when compared to the related [NO+]/[NO] and [SO+]/[SO]. As has been extensively illustrated elsewhere, a peculiarity of the P+ ion is that it does not react with H2, the most abundant molecule in the ISM, or with CO, because the processes are endothermic. Therefore, when P+ is formed in shocked regions where the ice of interstellar dust grains is released in the gas phase, its reaction with the abundant water molecules can contribute to the direct formation of PO+, albeit only with a 10% yield. Conversely, the reaction of N+ with H2 is quite fast at T>50 K and the ionisation potential of N is much larger than that of P, being also larger than that of H and H2. Therefore, the [NO+]/[NO] is probably governed by the ionisation of NO, while the [PO+]/[PO] has a significant contribution from the P+ reactions with abundant oxygenated partners.
The comparison can be extended to the SO+ case considering that S+, similarly to P+, does not react with H2 but, differently from P+, it does not react with H2O either (the experimental rate from SIFT measurements at 300 K is smaller than 10−12 (Smith et al. 1981)). This can be explained by the fact that the HSO+ plus H channel is endothermic, while the SO+ plus H2 channel is spin-forbidden. The reaction with O2 also favours the formation of PO+ with regard to SO+ since the rate measured at 300 K for P+ is 5.6 × 10⁻¹⁰ cm3 s−1 (Adams et al. 1990), and hence larger than that for S+, which is 1.5 × 10⁻¹¹ cm3 s−1 (Smith et al. 1981). Considering that the rate coefficients of P+ and S+ with OH are similar, we can speculate that the high abundance of PO+ with regard to PO observed by Rivilla et al. (2022) is mostly due to the reaction with water molecules.
9 Conclusions
This study reports an experimental and computational investigation of the ion-molecule reaction between P+ and water as a pathway to the formation of interstellar PO and PO+. For technical reasons, the experiments were performed using D2O instead of its hydrogenated analogue. Absolute CSs and BRs were obtained, highlighting the presence of POD+ as the dominant product, with a smaller contribution of PO+. The CSs and BRs were measured over a collision energy range of 0.1–3 eV in the centre-of-mass frame, using the GEMINI GIB set-up. An empirical function is proposed to describe the energy dependence of the total reactive CS, from which the corresponding temperature dependence of the rate coefficients, k(T), were derived in the T range of 10–5000 K. Our findings show a good agreement between the extrapolated rate coefficients and those previously measured at room temperature. A good match between the experimental data and the Langevin capture model is also observed, indicating that the polarisability of D2O plays a more significant role than its dipole moment in governing the reaction dynamics.
In parallel, the theoretical investigation of the multidimensional PH2O+/PD2O+ PES casts light on the energetic evolution of the various reaction channels and on their relative role. In particular, while the production of POH+ plus H can occur adiabatically on the triplet PES correlating with the ground electronic state, 3P, of P+, the production of PO+ (in its electronic ground state) plus H2 is possible only via ISC to the singlet PES, correlating with the P+(1D) + H2O reactants.
In conclusion, this study demonstrates that:
The reaction P+ + H2O leads mostly to POH+ plus H (BR = 90 ± 2%), with the PO+ + H2 channel being minor (BR = 10 ± 4%). In environments in which P is released in the gas phase from the icy mantles of interstellar grains due to shocks and then ionised, the reaction with water should be considered in astrochemical models. The obtained rate constant values range from 1.2 × 10⁻⁹ cm3 s−1 (at 10 K) to 7.5 × 10⁻¹⁰ cm3 s−1 (at 5000 K);
Among POH+ and HPO+ products, the former is the more stable isomer, with a significant difference in the enthalpy of formation of ∼110 kJ mol−1. Therefore, we can presume that it will also be preferentially formed in other routes already considered in the main astrochemical databases. POH+ is the relevant interstellar ion and an important precursor for PO formation;
The reaction of P+ with abundant water molecules can contribute to the direct formation of PO+, albeit with a 10% yield and can explain the high PO+/PO detected in the ISM (Rivilla et al. 2022);
Proton transfer to NH3 is an efficient way to convert POH+ into PO, with an estimated rate constant, k(T), in the range of 1.1–2.7 × 10⁻⁹ cm3 s−1 molecule−1. Energetics considerations indicate that proton transfer is non-dissociative.
Acknowledgements
The authors thank the Italian MUR PRIN2020 (2020AFB3FX-Astrochemistry beyond the second period elements) for support. NB acknowledges financial support from the Italian Space Agency (Bando ASI Prot. no. DC-DSR-UVS-2022-231, Grant no. 2023-10-U.0 MIGLIORA). MR acknowledges financial support under the National Recovery and Resilience Plan (NRRP), Mission 4, Component 2, Investment 1.1, Call for tender No. 104 published on 2.2.2022 by the Italian Ministry of University and Research (MUR), funded by the European Union – NextGenerationEU – Project Title 2022JC2Y93 ChemicalOrigins: linking the fossil composition of the Solar System with the chemistry of protoplanetary disks – CUP J53D23001600006 – Grant Assignment Decree No. 962 adopted on 30.06.2023 by the Italian Ministry of Ministry of University and Research (MUR) MM acknowledges the Department of Physics at the University of Trento for co-financing a PhD scholarship funding.
References
- Adams, N. G., McIntosh, B., & D., S. 1990, A&A, 232, 443 [Google Scholar]
- Agundez, M., Cernicharo, J., & Guelin, M. 2007, ApJ, 662, L91 [CrossRef] [Google Scholar]
- Agundez, M., Cernicharo, J., Decin, L., Encrenaz, P., & Teyssier, D. 2014, ApJ, 790 [Google Scholar]
- Alonso de la Fuente, J., Michielan, M., Sanz Sanz, C., et al. 2026, Phys. Chem. Chem. Phys., 28, 6377 [Google Scholar]
- Altwegg, K., Balsiger, H., Bar-Nun, A., et al. 2016, Sci. Adv., 2, e1600285 [NASA ADS] [CrossRef] [Google Scholar]
- Ascenzi, D., Cont, N., Guella, G., Franceschi, P., & Tosi, P. 2007, J. Phys. Chem. A, 111, 12513 [CrossRef] [Google Scholar]
- Asplund, M., Grevesse, N., Sauval, A. J., & Scott, P. 2009, ARA&A, 47, 481 [NASA ADS] [CrossRef] [Google Scholar]
- Balucani, N., Bergeat, A., Cartechini, L., et al. 2009, J. Phys. Chem. A, 113, 11138 [Google Scholar]
- Balucani, N., Skouteris, D., Leonori, F., et al. 2012, J. Phys. Chem. A, 116, 10467 [Google Scholar]
- Balucani, N., Caracciolo, A., Vanuzzo, G., et al. 2023, Faraday Discuss., 245, 327 [Google Scholar]
- Bartlett, R. J. 1981, Annu. Rev. Phys. Chem., 32, 359 [Google Scholar]
- Bass, L., Su, T., Chesnavich, W., & Bowers, M. 1975, Chem. Phys. Lett., 34, 119 [NASA ADS] [CrossRef] [Google Scholar]
- Becke, A. D. 1993, J. Chem. Phys., 98, 1372 [Google Scholar]
- Bergner, J. B., Oberg, I, K., Walker, S., et al. 2019, ApJL, 884 [Google Scholar]
- Bergner, J. B., Burkhardt, A. M., Oberg, I. K., Rice, T. S., & Bergin, E. A. 2022, ApJ, 927 [Google Scholar]
- Bernal, J. J., Koelemay, L. A., & Ziurys, L. M. 2021, ApJ, 906 [Google Scholar]
- Chantzos, J., Rivilla, V. M., Vasyunin, A., et al. 2020, A&A, 633 [Google Scholar]
- Charnley, S. B., & Millar, T. J. 1994, MNRAS, 270, 570 [NASA ADS] [CrossRef] [Google Scholar]
- Czyzak, S., & Krueger, T. 1963, MNRAS, 126, 177 [Google Scholar]
- De Beck, E., Kaminski, T., Patel, N. A., et al. 2013, A&A, 558 [Google Scholar]
- Di Genova, G., Balucani, N., Mancini, L., et al. 2025, A&A, 704, A305 [NASA ADS] [CrossRef] [EDP Sciences] [Google Scholar]
- Douglas, K. M., Gobrecht, D., & Plane, J. M. 2022, MNRAS, 515, 99 [NASA ADS] [CrossRef] [Google Scholar]
- Dufton, P., Keenan, F., & Hibbert, A. 1986, A&A, 164, 179 [Google Scholar]
- Dunning Jr, T. H. 1989, J. Chem. Phys., 90, 1007 [NASA ADS] [CrossRef] [Google Scholar]
- Ervin, K. M., & Armentrout, P. B. 1985, J. Chem. Phys., 83, 166 [Google Scholar]
- Esseffar, M., Luna, A., Mó, O., & Yáñez, M. 1993, Chem. Phys. Lett., 209, 557 [Google Scholar]
- Esseffar, M., Luna, A., Mo, O., & Yanez, M. 1994, J. Phys. Chem., 98, 8679 [Google Scholar]
- Falcinelli, S., Bartocci, A., Cavalli, S., Pirani, F., & Vecchiocattivi, F. 2016a, Chem. Eur. J., 22, 764 [Google Scholar]
- Falcinelli, S., Rosi, M., Cavalli, S., Pirani, F., & Vecchiocattivi, F. 2016b, Chem. Eur. J., 22, 12518 [Google Scholar]
- Filippi, A., Occhiucci, G., & Speranza, M. 1997, Inorg. Chem., 36, 3936 [Google Scholar]
- Fontani, F. 2024, Front. Astron. Space Sci., 11 [Google Scholar]
- Fontani, F., Rivilla, V. M., Caselli, P., Vasyunin, A., & Palau, A. 2016, ApJL, 822 [Google Scholar]
- Fontani, F., Rivilla, V. M., van der Tak, F. F. S., et al. 2019, MNRAS, 489, 4530 [CrossRef] [Google Scholar]
- Fontani, F., Mininni, C., Beltran, M. T., et al. 2024, A&A, 682 [Google Scholar]
- Franceschi, P., Penasa, L., Ascenzi, D., et al. 2007, Int. J. Mass Spectrom., 265, 224 [NASA ADS] [CrossRef] [Google Scholar]
- Frisch, M., Trucks, G., Schlegel, H., et al. 2009, Gaussian 09, Revision A. 02, 2009, Gaussian, Inc., Wallingford, CT [Google Scholar]
- Garcia de la Concepcion, J., Puzzarini, C., Barone, V., Jimenez-Serra, I., & Roncero, O. 2021, ApJ, 922 [Google Scholar]
- Gonzalez, C., & Schlegel, H. B. 1989, J. Chem. Phys., 90, 2154 [Google Scholar]
- Gonzalez, C., & Schlegel, H. B. 1990, J. Phys. Chem., 94, 5523 [Google Scholar]
- Haasler, D., Rivilla, V. M., Martin, S., et al. 2022, A&A, 659 [Google Scholar]
- Halfen, D. T., Clouthier, D. J., & Ziurys, L. M. 2008, ApJ, 677, L101 [NASA ADS] [CrossRef] [Google Scholar]
- Hanwell, M. D., Curtis, D. E., Lonie, D. C., et al. 2012, J. Cheminform., 4, 1 [Google Scholar]
- Hemsworth, R. S., Payzant, J. D., Schiff, H. I., & Bohme, D. K. 1974, Chem. Phys. Lett., 26, 417 [NASA ADS] [CrossRef] [Google Scholar]
- Huang, K.-N. 1985, At. Data. Nucl. Data Tables, 32, 503 [Google Scholar]
- Jenkins, E. B., Savage, B. D., & Spitzer, L., Jr. 1986, ApJ, 301, 355 [NASA ADS] [CrossRef] [Google Scholar]
- Jimenez-Serra, I., Viti, S., Quenard, D., & Holdship, J. 2018, ApJ, 862 [Google Scholar]
- Jura, M., & York, D. G. 1978, ApJ, 219, 861 [NASA ADS] [CrossRef] [Google Scholar]
- Kama, M., Shorttle, O., Borthakur, S. P., et al. 2025, MNRAS, 542, 3402 [Google Scholar]
- Kendall, R. A., Dunning Jr, T. H., & Harrison, R. J. 1992, J. Chem. Phys., 96, 6796 [NASA ADS] [CrossRef] [Google Scholar]
- Klippenstein, S. J. 1992, J. Chem. Phys., 96, 367 [NASA ADS] [CrossRef] [Google Scholar]
- Kramida, A., Yu. Ralchenko, Reader, J., & and NIST ASD Team. 2024, NIST Atomic Spectra Database (ver. 5.12), [Online]. National Institute of Standards and Technology, Gaithersburg, MD. [Google Scholar]
- Largo, A., Redondo, P., Barrientos, C., & Ugalde, J. M. 1991, J. Phys. Chem., 95, 5443 [Google Scholar]
- Lauretta, D. S., Connolly Jr, H. C., Aebersold, J. E., et al. 2024, Meteor. Planet. Sci., 59, 2453 [Google Scholar]
- Lefloch, B., Vastel, C., Viti, S., et al. 2016, MNRAS, 462, 3937 [CrossRef] [Google Scholar]
- Lefloch, B., Codella, C., Montarges, M., et al. 2024, A&A, 687 [Google Scholar]
- Liang, P., De Aragão, E. V., Pannacci, G., et al. 2023a, J. Phys. Chem. A, 127, 685 [Google Scholar]
- Liang, P., de Aragao, E. V. F., Giani, L., et al. 2023b, J. Phys. Chem. A, 127, 4609 [Google Scholar]
- Linstrom, P. J., & Mallard, W. G. 2026, NIST Chemistry WebBook – Standard Reference Database no. 69 [Online] [Google Scholar]
- MacKay, D., & Charnley, S. 2001, MNRAS, 325, 545 [Google Scholar]
- Mancini, L., Vanuzzo, G., Marchione, D., et al. 2021, J. Phys. Chem. A, 125, 8846 [Google Scholar]
- Mancini, L., Rosi, M., Skouteris, D., et al. 2023, Comput. Theor. Chem., 1229, 114341 [Google Scholar]
- Mancini, L., Valença Ferreira De Aragão, E., Pirani, F., et al. 2024a, A&A, 691, A83 [NASA ADS] [CrossRef] [EDP Sciences] [Google Scholar]
- Mancini, L., Vanuzzo, G., Recio, P., et al. 2024b, J. Phys. Chem. A, 128, 7177 [Google Scholar]
- Michielan, M., Mancini, L., Ascenzi, D., et al. 2025, A&A, 698, A205 [NASA ADS] [CrossRef] [EDP Sciences] [Google Scholar]
- Milam, S. N., Halfen, D. T., Tenenbaum, E. D., et al. 2008, ApJ, 684, 618 [NASA ADS] [CrossRef] [Google Scholar]
- Millar, T. J. 1991, A&A, 242, 241 [NASA ADS] [Google Scholar]
- Millar, T. J., Walsh, C., Van de Sande, M., & Markwick, A. J. 2024, A&A, 682, A109 [NASA ADS] [CrossRef] [EDP Sciences] [Google Scholar]
- Mininni, C., Fontani, F., Rivilla, V. M., et al. 2018, MNRAS, 476, L39 [CrossRef] [Google Scholar]
- Nahar, S. N., & Shafique, B. 2025, Can. J. Phys., 103, 100 [Google Scholar]
- Olsen, J., Jo/rgensen, P., Koch, H., Balkova, A., & Bartlett, R. J. 1996, J. Chem. Phys., 104, 8007 [Google Scholar]
- Pannacci, G., Mancini, L., Vanuzzo, G., et al. 2023, Phys. Chem. Chem. Phys., 25, 20194 [Google Scholar]
- Pantaleone, S., De Gasperis, G., Corno, M., et al. 2024, ACS Earth Space Chem., 8, 2310 [Google Scholar]
- Pantaleone, S., Corno, M., Rimola, A., Balucani, N., & Ugliengo, P. 2025, ACS Earth Space Chem., 9, 211 [Google Scholar]
- Pasek, M. A. 2017, Geosci. Front., 8, 329 [Google Scholar]
- Pilorget, C., Baklouti, D., Bibring, J. P., et al. 2024, Nat. Astron., 8 [Google Scholar]
- Qin, Z., Hu, P., Li, J., & Liu, L. 2023, MNRAS, 523, 2684 [Google Scholar]
- Raghavachari, K., Trucks, G. W., Pople, J. A., & Head-Gordon, M. 1989, Chem. Phys. Lett., 157, 479 [Google Scholar]
- Ravi, R., Singh, A. P., Richards, A. M. S., et al. 2024, ApJL, 971 [Google Scholar]
- Richardson, V., de Aragão, E. V. F., He, X., et al. 2022, Phys. Chem. Chem. Phys., 24, 22437 [Google Scholar]
- Ritchey, A. M., Jenkins, E. B., Shull, J. M., et al. 2023, ApJ, 952, 57 [NASA ADS] [CrossRef] [Google Scholar]
- Rivilla, V. M., Fontani, F., Beltran, M. T., et al. 2016, ApJ, 826 [Google Scholar]
- Rivilla, V. M., Jimenez-Serra, I., Zeng, S., et al. 2018, MNRAS, 475, L30 [NASA ADS] [CrossRef] [Google Scholar]
- Rivilla, V. M., Drozdovskaya, M. N., Altwegg, K., et al. 2020, MNRAS, 492, 1180 [Google Scholar]
- Rivilla, V. M., de la Concepcion, J. G., Jimenez-Serra, I., et al. 2022, Front. Astron. Space Sci., 9 [Google Scholar]
- Rosi, M., Skouteris, D., Balucani, N., et al. 2019, in International Conference on Computational Science and Its Applications (Springer), 306 [Google Scholar]
- Ruscic, B., & Bross, D. 2020, Active Thermochemical Tables (ATcT) values based on ver. 1.122p of the Thermochemical Network [Online] [Google Scholar]
- Russell, D. J. I. 2020, NIST Computational Chemistry Comparison and Benchmark Database, NIST Standard Reference Database Number 101 http://cccbdb.nist.gov/, release 21, August 2020 [Google Scholar]
- Scibelli, S., Megias, A., Jimenez-Serra, I., et al. 2025, ApJL, 985 [Google Scholar]
- Sil, M., Srivastav, S., Bhat, B., et al. 2021, Astron. J., 162 [Google Scholar]
- Skouteris, D., Balucani, N., Ceccarelli, C., et al. 2019, MNRAS, 482, 3567 [CrossRef] [Google Scholar]
- Smith, D., Adams, N. G., & Lindinger, W. 1981, J. Chem. Phys., 75, 3365 [NASA ADS] [CrossRef] [Google Scholar]
- Smith, D., McIntosh, B. J., & Adams, N. G. 1989, J. Chem. Phys., 90, 6213 [Google Scholar]
- Souza, A. C., Silva, M. X., & Galvão, B. R. 2021, MNRAS, 507, 1899 [NASA ADS] [CrossRef] [Google Scholar]
- Stephens, P. J., Devlin, F. J., Chabalowski, C. F., & Frisch, M. J. 1994, J. Phys. Chem., 98, 11623 [CrossRef] [Google Scholar]
- Su, T., & Chesnavich, W. J. 1982, J. Chem. Phys., 76, 5183 [NASA ADS] [CrossRef] [Google Scholar]
- Su, T., Su, E. C. F., & Bowers, M. T. 1978, J. Chem. Phys., 69, 2243 [NASA ADS] [CrossRef] [Google Scholar]
- Taquet, V., Wirström, E. S., & Charnley, S. B. 2016, ApJ, 821, 46 [Google Scholar]
- Teloy, E., & Gerlich, D. 1974, Chem. Phys., 4, 417 [NASA ADS] [CrossRef] [Google Scholar]
- Tenenbaum, E. D., Woolf, N. J., & Ziurys, L. M. 2007, ApJ, 666, L29 [NASA ADS] [CrossRef] [Google Scholar]
- Thorne, L. R., Anicich, V. G., & Huntress, W. T. 1983, Chem. Phys. Lett., 98, 162 [NASA ADS] [CrossRef] [Google Scholar]
- Thorne, L. R., Anicich, V. G., Prasad, S. S., & Huntress, W. T. Jr. 1984, ApJ, 280, 139 [NASA ADS] [CrossRef] [Google Scholar]
- Tsikritea, A., Diprose, J. A., Softley, T. P., & Heazlewood, B. R. 2022, J. Chem. Phys., 157, 060901 [NASA ADS] [CrossRef] [Google Scholar]
- Turner, B. E., & Bally, J. 1987, ApJ, 321, L75 [NASA ADS] [CrossRef] [Google Scholar]
- Vanuzzo, G., Mancini, L., Pannacci, G., et al. 2022a, ACS Earth Space Chem., 6, 2305 [Google Scholar]
- Vanuzzo, G., Marchione, D., Mancini, L., et al. 2022b, J. Phys. Chem. A, 126, 6110 [Google Scholar]
- Wakelam, V., Smith, I. W. M., Herbst, E., et al. 2010, Space Sci. Rev., 156, 13 [CrossRef] [Google Scholar]
- Wakelam, V., Loison, J.-C., Herbst, E., et al. 2015, ApJS, 217, 20 [Google Scholar]
- Wakelam, V., Gratier, P., Loison, J.-C., et al. 2024, A&A, 689, A63 [NASA ADS] [CrossRef] [EDP Sciences] [Google Scholar]
- Wallstrom, S. H. J., Danilovich, T., Mueller, H. S. P., et al. 2024, A&A, 681 [Google Scholar]
- Werner, H.-J., Knowles, P. J., Manby, F. R., et al. 2020, J. Chem. Phys., 152, 144107 [NASA ADS] [CrossRef] [Google Scholar]
- Woon, D. E., & Dunning Jr, T. H. 1993, J. Chem. Phys., 98, 1358 [NASA ADS] [CrossRef] [Google Scholar]
- Wurmser, S., & Bergner, J. B. 2022, ApJ, 934 [Google Scholar]
- Ziurys, L. M. 1987, ApJ, 321, L81 [NASA ADS] [CrossRef] [Google Scholar]
- Ziurys, L. M., Schmidt, D. R., & Bernal, J. J. 2018, ApJ, 856, 169 [NASA ADS] [CrossRef] [Google Scholar]
Appendix A Excited states quenching in the P+ ion beam
While the inclusion of N2 in the gas mixture used to generate the P+ parent ion is mainly to achieve collisional quenching of the excited states, D2 serves as a reactive quencher for the electronically excited states that will react via D-atom transfer reaction (A.1):
 (A.1)
(A.1)
Reaction enthalpies from the different electronic states of P+ are reported in Table A.1: the ground state (3P) reaction is endothermic by 1.27 eV, and therefore closed at low collision energies. It becomes exothermic (by 1.41 eV), hence very efficient, for the second excited state (1S0) and it is weakly endothermic (by 0.17 eV) for the first excited state (1D), but becomes exothermic for rotationally excited D2. Since the gas in the ion source has a temperature of at least 300 K, rotational levels up to j = 6 might be populated, thus leading to efficient quenching also for the 1D state (Alonso de la Fuente et al. 2026).
Reaction enthalpies (∆rxnH0) for the reaction of P+ with D2
The enthalpies of reaction of the different electronic states of P+ with N2 according to reaction (A.2) are shown in Table A.2:
 (A.2)
(A.2)
Since the reaction of P+(3P) with N2 is expected to give no products except at high collision energies, it is a viable method to probe the presence of residual electronically excited population in the ion beam. Reaction (A.2) has been independently studied with both the GEMINI and CERISES GIB apparatuses, the latter being installed at the DESIRS VUV beamline of the SOLEIL synchrotron radiation facility. While in GEMINI P+ ions are produced by electron ionisation, in CERISES they are generated by dissociative photoionisation of PCl3 at selected photon energies Ephot, thus allowing a state-selection of the ground state of the parent ion. Absolute CS for the PN+ product (m/z 45) as a function of collision energy from both experimental set-ups are compared in Fig. A.1 to assess excited state contamination in the ion beam by focusing on the thresholds related to the emergence of the product.
Both GEMINI and CERISES data exhibit a distinct energy threshold, above which the reaction occurs, with CSs increasing as a function of collision energy. The threshold was estimated to be 4.0 ± 0.1 eV for both data sets, a value consistent with the reactivity of P+ in its ground state. In the presence of excited states 1D and 1S , lower energy thresholds would be expected, in accordance with the endothermicity reported in Table A.2. This observation suggests the absence of excited-state contamination in the P+ beam used in GEMINI and CERISES experiments at Ephot = 22.6 eV.
Reaction enthalpies (∆H0) for the reaction of P+ with N2
 |
Fig. A.1 Experimental CSs for the reaction of P+ with N2 as a function of the collision energy, ECM. The blue circles are the profile obtained at Ephot = 22.6 eV, and the black stars are the CS obtained from the measurements with GEMINI. |
Appendix B Branching ratios as a function of collision energy
The experimental BRs for the reaction of P+ with D2O as a function of collision energy in the explored range (0.1-3 eV) are shown in Fig. B.1
Appendix C Full PES for the P+(3P)+H2O and P+(1D)+H2O reactions
The detailed triplet PES for the reaction of P+(3P) with H2O is shown in Fig. C.1. The barrierless association process leads to the formation of the 3MIN1 intermediate, located at 248 kJ mol−1 below the energy of the reactants, which represents a stabilised electrostatic adduct. From 3MIN1, the system can evolve either via isomerisation through 3TS1 (to form the 3MIN2 intermediate), or via O-H bond fission, leading to the POH+ + H products. Additionally, a less favourable H2 elimination process could take place, leading to the formation of PO+ + H2, located 197 kJ mol−1 above the energy of the reactants. The 3MIN2 intermediate can further isomerise via 3TS3 (whose relative energy is +26 kJ mol−1) to 3MIN3, located 72 kJ mol−1 below the energy f the reactants. In addition, dissociation from 3MIN2 can lead to POH+ + H or to HPO+ + H. This last product channel is located 59 kJ mol−1 above th energy of the reactants, therefore is not considered a favourable reaction pathways. Finally, the 3MIN3 intermediate connects to several endothermic dissociation channels, including the formation of PO+ + H2 (relative energy, Erel = +197 kJ mol−1),  (Erel = +238 kJ mol−1) and the aforementioned HPO+ cation. Overall, the PES highlights the presence of several highly endothermic products, which are not favourably formed in the temperature range of interstellar environments.
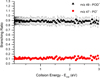 |
Fig. B.1 Experimental BRs scanned across the collision energy range (0.1–3 eV) in the center of mass frame. The trends related to both the products show a constant behaviour, i.e. no dependence on the collision energy. |
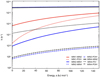 |
Fig. B.2 Unimolecular rate constants for the exothermic channels as a function of energy, including both decomposition to products and isomerisation processes. |
Similarly to the triplet case, different minima and transition states can be identified on the singlet PES, which is shown in Fig. C.2. However, a key difference lies in the presence of two possible intermediates with HPOH structure, arising from rotation around the po bond, which acquires a partial multiple-bond character along the reaction co-ordinate. As in the triplet PES, the system leads to essentially the same pairs of products, with the notable exception that the channel PO+ + H2 becomes the most exothermic. This is due to spin conservation, which allows the formation of PO+ in its singlet ground state.
Appendix D Unimolecular decomposition rate constants
In Fig. B.2 are reported the unimolecular rate constants (in s−1) for all the isomerisation and dissociation processes of the reaction P+(1D) + H2O, used to derive the values of the branching fractions. As shown in Fig. 4, on the singlet PES the formation of POH+ is mainly driven by the dissociation of MIN1. However, this process competes with the isomerisation to MIN2, which proceeds more rapidly than dissociation, and subsequently to MIN4. This sequence of isomerisations accounts for the predominance of PO+ in the overall branching fraction values.
Appendix E Full PES for the PO+N(4S) reaction
In addition to the main reaction pathway already discussed in the main text, other possible pathways have been derived for the N(4S) + PO system, and they are reported in Fig. E.1. Specifically, the attack of atomic nitrogen on the oxygen side of the PO molecule leads to the formation of an intermediate located 42 kJ mol−1 above the reactant asymptote. This process is characterised by an entrance barrier of 120 kJ mol−1. The resulting intermediate can either isomerise to MIN1c or MIN6c via a transition state situated 180 kJ mol−1 above the reactants, or dissociate yielding to P + NO products. All these pathways involve intermediates and transition states lying above the energy of the reactants, making them unlikely to contribute significantly under typical astrochemical conditions.
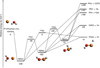 |
Fig. C.1 Schematic representation of PES obtained for the P+(3P)+H2O reaction. All the reported energies were evaluated at the CCSD(T)/aug-cc-pV(T+d)Z//B3LYP/aug-cc-pV(T+d)Z level of theory. |
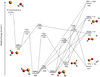 |
Fig. C.2 Schematic representation of PES obtained for the P+(1D)+H2O reaction. All the reported energies were evaluated at the CCSD(T)/aug-cc-pV(T+d)Z//B3LYP/aug-cc-pV(T+d)Z level of theory. |
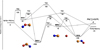 |
Fig. E.1 Schematic representation of PES obtained for the PO+N(4S) reaction. All the reported energies were evaluated at the CCSD(T)/aug-cc-pV(T+d)Z//B3LYP/aug-cc-pV(T+d)Z level of theory. |
As obtained from Table 1 of Bass et al. (1975), which reports c values as a function of the ratio µ/α1/2, where µ and α are the permanent dipole moment and polarisability of the neutral species (D2O), respectively. Using µ = 1.86 Debye and α = 1.47 Å3, the ratio equals 1.537, and c = 0.243 is obtained by interpolating the tabulated values.
All Tables
Reaction energies (∆E) for the identified products coming from the reaction of P+ with H2O.
Branching ratios (BR%) for the reactions with H2O/D2O at different temperatures from RRKM calculations.
All Figures
|
Fig. 1 Experimental CS for the reaction channels as a function of the collision energy, ECM. The solid red circles are the absolute CSs for the main channel at m/z 49 (POD+/DPO+), while the solid black squares refer to the PO+ product, at m/z 47. |
| In the text | |
|
Fig. 2 CSs for the reaction of P+ with D2O as a function of collision energy, ECM. The orange-filled stars are the experimental total CS, the red line is the CSs as estimated from the Langevin model, and the dashed violet curve is the CSs according to the ADO model. The black-filled triangles and the blue-filled circles come from our fitted model to extract the true CS from the experimental data: the blue circles represent the fitting function, while the black filled triangles represent the form of the true CS extracted as a result of the fitting procedure. Further details are discussed in Sect. 4.2. |
| In the text | |
|
Fig. 3 Rate constants as a function of temperature. The extrapolation obtained from the experimental data is given by the filled black circles. Langevin model is represented by the red line, while the Su-Chesnavich and ADO models are represented in orange and violet, respectively. The rate constant value, measured with H2O (Smith et al. 1989; Thorne et al. 1983) is reported as a blue square. |
| In the text | |
|
Fig. 4 Schematic representation of PES obtained for the P+ + H2O (data in black) and for the P+(3P) + D2O (data in blue in square brackets) reactions. All the reported energies were evaluated at the CCSD(T)/CBS//B3LYP/aug-cc-pV(T+d)Z level of theory. Black lines indicate the triplet PES correlating with P+(3P), while red lines represents the singlet PES correlating with P+(1D). |
| In the text | |
|
Fig. 5 Schematic representation of PES obtained for the POH+ + NH3 reaction. All the reported energies were evaluated at the CCSD(T)/CBS//B3LYP/aug-cc-pV(T+d)Z level of theory. |
| In the text | |
|
Fig. 6 Schematic representation of PES obtained for the PO + N(4S) reaction. All the reported energies were evaluated at the CCSD(T)/CBS//B3LYP/aug-cc-pV(T+d)Z level of theory. |
| In the text | |
|
Fig. A.1 Experimental CSs for the reaction of P+ with N2 as a function of the collision energy, ECM. The blue circles are the profile obtained at Ephot = 22.6 eV, and the black stars are the CS obtained from the measurements with GEMINI. |
| In the text | |
|
Fig. B.1 Experimental BRs scanned across the collision energy range (0.1–3 eV) in the center of mass frame. The trends related to both the products show a constant behaviour, i.e. no dependence on the collision energy. |
| In the text | |
|
Fig. B.2 Unimolecular rate constants for the exothermic channels as a function of energy, including both decomposition to products and isomerisation processes. |
| In the text | |
|
Fig. C.1 Schematic representation of PES obtained for the P+(3P)+H2O reaction. All the reported energies were evaluated at the CCSD(T)/aug-cc-pV(T+d)Z//B3LYP/aug-cc-pV(T+d)Z level of theory. |
| In the text | |
|
Fig. C.2 Schematic representation of PES obtained for the P+(1D)+H2O reaction. All the reported energies were evaluated at the CCSD(T)/aug-cc-pV(T+d)Z//B3LYP/aug-cc-pV(T+d)Z level of theory. |
| In the text | |
|
Fig. E.1 Schematic representation of PES obtained for the PO+N(4S) reaction. All the reported energies were evaluated at the CCSD(T)/aug-cc-pV(T+d)Z//B3LYP/aug-cc-pV(T+d)Z level of theory. |
| In the text | |
Current usage metrics show cumulative count of Article Views (full-text article views including HTML views, PDF and ePub downloads, according to the available data) and Abstracts Views on Vision4Press platform.
Data correspond to usage on the plateform after 2015. The current usage metrics is available 48-96 hours after online publication and is updated daily on week days.
Initial download of the metrics may take a while.