| Issue |
A&A
Volume 584, December 2015
|
|
|---|---|---|
| Article Number | A111 | |
| Number of page(s) | 10 | |
| Section | Interstellar and circumstellar matter | |
| DOI | https://doi.org/10.1051/0004-6361/201526431 | |
| Published online | 01 December 2015 | |
Online material
Appendix A: Deriving the power spectrum of the SPIRE 250 μm beam
The power spectrum of the SPIRE 250 μm beam was derived from an empirical PSF image obtained by the SPIRE ICC from scan map data10 of Neptune in four directions. There are two sets of empirical PSFs available, one gridded at the nominal pixel size for each SPIRE passband and the other at a higher pixel resolution of 0.̋6. We used the latter product, but the angular extent of the footprint was only about 6.́0, corresponding to an angular frequency scale of ~0.3 arcmin-1, insufficient to correct for the beam convolution effect on large scales (i.e., small ![]() ). Therefore, to extend the angular frequency range of the beam power spectrum to lower
). Therefore, to extend the angular frequency range of the beam power spectrum to lower ![]() values, we embedded the beam map of Neptune inside a larger map 25.́0 on a side, and then padded the pixels outside the central Neptune insert using the best-fit 2D Gaussian approximation to the beam.
values, we embedded the beam map of Neptune inside a larger map 25.́0 on a side, and then padded the pixels outside the central Neptune insert using the best-fit 2D Gaussian approximation to the beam.
The power spectrum of the SPIRE 250 μm beam as a function of angular frequency, ![]() , is shown in Fig. A.1. The power spectrum asymptotically converges to unity at small angular frequencies, but rapidly declines toward high angular frequencies (small angular scales). We caution that the SPIRE beam spectrum has a slight suppression of power around 0.2 arcmin-1<
, is shown in Fig. A.1. The power spectrum asymptotically converges to unity at small angular frequencies, but rapidly declines toward high angular frequencies (small angular scales). We caution that the SPIRE beam spectrum has a slight suppression of power around 0.2 arcmin-1<![]() < 1.5 arcmin-1 compared to a pure Gaussian shape. This problem led Martin et al. (2010) and Miville-Deschênes et al. (2010) to approximate the beam power spectrum using higher-order polynomial corrections to the Gaussian fit. The effective full width at half maximum (FWHM) of the SPIRE 250 μm beam power spectrum11 is about 2 arcmin-1, as shown by the dashed curve in Fig. A.1.
< 1.5 arcmin-1 compared to a pure Gaussian shape. This problem led Martin et al. (2010) and Miville-Deschênes et al. (2010) to approximate the beam power spectrum using higher-order polynomial corrections to the Gaussian fit. The effective full width at half maximum (FWHM) of the SPIRE 250 μm beam power spectrum11 is about 2 arcmin-1, as shown by the dashed curve in Fig. A.1.
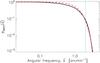 |
Fig. A.1
Power spectrum of the SPIRE 250 μm beam, |
| Open with DEXTER | |
Appendix B: Results from high-resolution column density maps
Figure B.1 shows the power spectrum of the same filament already displayed in Fig. 2, but here derived from a high-resolution column density map obtained using the multi-scale decomposition scheme of Palmeirim et al. (2013). The power spectrum values at high spatial frequencies has more scatter than the one derived by converting I250 to H2-column density (see Fig. 4). This is primarily because the multi-scale decomposition technique introduces fluctuations at small spatial scales which manifest themselves through enhanced scatter in the Fourier modes at high spatial frequencies. The distribution of power spectrum slopes derived from high-resolution column density maps for the whole sample of filaments is shown in Fig. B.2. The mean power spectrum slopes before and after correcting for the beam effect are ![]() and
and ![]() , respectively. Within the quoted errors, these results are indistinguishable from those found in Sect. 5.1 using modified 250 μm maps.
, respectively. Within the quoted errors, these results are indistinguishable from those found in Sect. 5.1 using modified 250 μm maps.
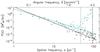 |
Fig. B.1
Power spectrum of the line-mass fluctuations along the Pipe filament shown in Fig. 2 as measured in the high-resolution H2-column density map resulting from the multi-scale decomposition technique of Palmeirim et al. (2013) Fig. 4. The power-law fits to the power spectra Pobs(s) (black plus symbols) and Ptrue(s) (cyan filled circles) have logarithmic slopes αobs = −2.3 ± 0.2 and αcorr = −1.7 ± 0.3, respectively. |
| Open with DEXTER | |
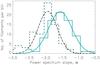 |
Fig. B.2
Distributions of power spectrum slopes measured in the high-resolution H2-column density maps before beam correction (dashed histogram) and after beam correction (solid histogram). Similar to Fig. 7 but based on data from the high-resolution column density maps instead of the modified 250 μm maps. Best-fit Gaussian curves to the two observed distributions are overplotted. The two distributions are centered on αobs = −1.9 ± 0.3 and αcorr = −1.6 ± 0.45 for the uncorrected and beam-corrected power spectra, respectively. |
| Open with DEXTER | |
© ESO, 2015
Current usage metrics show cumulative count of Article Views (full-text article views including HTML views, PDF and ePub downloads, according to the available data) and Abstracts Views on Vision4Press platform.
Data correspond to usage on the plateform after 2015. The current usage metrics is available 48-96 hours after online publication and is updated daily on week days.
Initial download of the metrics may take a while.