| Issue |
A&A
Volume 584, December 2015
|
|
|---|---|---|
| Article Number | A119 | |
| Number of page(s) | 16 | |
| Section | Galactic structure, stellar clusters and populations | |
| DOI | https://doi.org/10.1051/0004-6361/201425253 | |
| Published online | 07 December 2015 | |
Online material
Appendix A: The control field
In the observations and the simulations we consider a control region where neither filamentary structures nor cores are present (box 0 in Figs. 2 and 3). Figure A.1 shows the histograms of the column density distributions on the left, and the PDFs on the right. Since only a few bins are covered in the column
density distribution, these plots are shown here in the Appendix. However, the small error bar in each bin emphasizes that the column density distributions show only a peak without any additional structure. This peak at AV ~ 0.5 mag is very narrow in the observations, while in the simulations the peak is much broader.
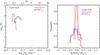 |
Fig. A.1
Left panel: histograms of the column density distributions of the control field, right panel: PDFs. The dashed lines overplotted on the PDFs show the best Gaussian fit of the data. The red lines are for the observations, the blue for the simulations. |
| Open with DEXTER | |
Appendix B: Filamentary structures in the Serpens core
Figure B.1 shows the zoom on filament number 1: starting from the left side, the first five panels show the Herschel, PACS and
SPIRE mosaics, while the last two panels show the column density and the temperature map. An additional box identifies the position of a core structure along the filament.
Figures B.2–B.9 show the enlargements on each filament as in Fig. B.1.
|
Fig. B.1
Filament number 1. From left to right: Herschel/PACS 70 μm, 160 μm, and SPIRE 250 μm, 350 μm, and 500 μm. The images all use units of Jy/arcsec2. Last two panels: column density map (NH) in [×10+20 cm-2] and the temperature map in K. The box identifies the extension of the filament and its size is given in Table 2. The smaller box identifies the position of the cores along the filament. |
|
| Open with DEXTER | |
|
Fig. B.2
Filament number 2. The panels and the units are as in Fig. B.1. |
|
| Open with DEXTER | |
|
Fig. B.3
Filament number 3. The panels and the units are as in Fig. B.1. |
|
| Open with DEXTER | |
|
Fig. B.4
Filament number 4. The panels and the units are as in Fig. B.1. |
|
| Open with DEXTER | |
|
Fig. B.5
Filament number 5. The panels and the units are as in Fig. B.1. |
|
| Open with DEXTER | |
|
Fig. B.6
Filament number 6. The panels and the units are as in Fig. B.1. |
|
| Open with DEXTER | |
|
Fig. B.7
Filament number 7. The panels and the units are as in Fig. B.1. The smaller box identifies the position of the core along the filament. |
|
| Open with DEXTER | |
|
Fig. B.8
Filament number 8. The panels and the units are as in Fig. B.1. |
|
| Open with DEXTER | |
|
Fig. B.9
Filament number 9. The panels and the units are as in Fig. B.1. |
|
| Open with DEXTER | |
© ESO, 2015
Current usage metrics show cumulative count of Article Views (full-text article views including HTML views, PDF and ePub downloads, according to the available data) and Abstracts Views on Vision4Press platform.
Data correspond to usage on the plateform after 2015. The current usage metrics is available 48-96 hours after online publication and is updated daily on week days.
Initial download of the metrics may take a while.