Fig. B.1
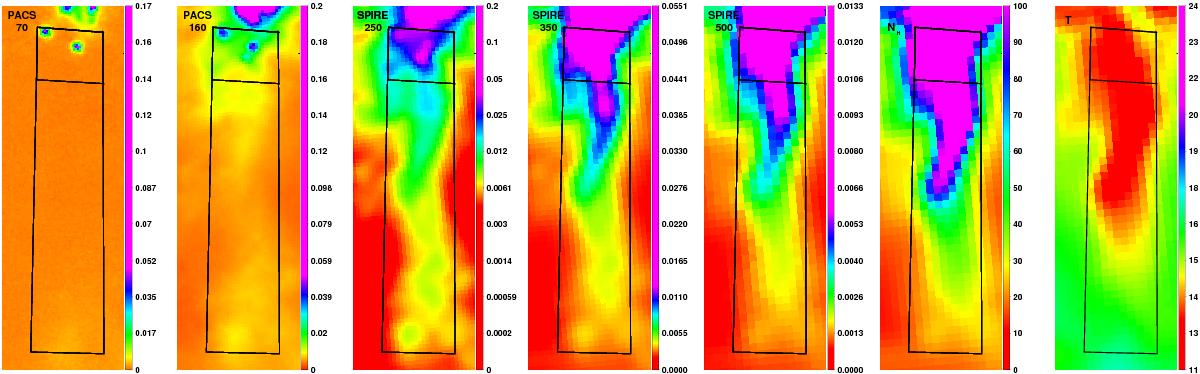
Filament number 1. From left to right: Herschel/PACS 70 μm, 160 μm, and SPIRE 250 μm, 350 μm, and 500 μm. The images all use units of Jy/arcsec2. Last two panels: column density map (NH) in [×10+20 cm-2] and the temperature map in K. The box identifies the extension of the filament and its size is given in Table 2. The smaller box identifies the position of the cores along the filament.
Current usage metrics show cumulative count of Article Views (full-text article views including HTML views, PDF and ePub downloads, according to the available data) and Abstracts Views on Vision4Press platform.
Data correspond to usage on the plateform after 2015. The current usage metrics is available 48-96 hours after online publication and is updated daily on week days.
Initial download of the metrics may take a while.