| Issue |
A&A
Volume 582, October 2015
|
|
|---|---|---|
| Article Number | L4 | |
| Number of page(s) | 5 | |
| Section | Letters | |
| DOI | https://doi.org/10.1051/0004-6361/201527254 | |
| Published online | 07 October 2015 | |
Online material
Appendix A: Complementary figures
 |
Fig. A.1
Map of the 339 GHz continuum emission of PKS 1830−211 showing the two resolved lensed images of the blazar (left). Overview of the ArH+ absorption spectrum toward PKS 1830−211 SW (bottom right) and NE (top right) from the current observations. Expected positions of the main absorption feature are indicated for 36ArH+, 38ArH+, and 40ArH+; the last is not detected. The noise increases toward lower frequencies because of the proximity of the atmospheric water line near 325.2 GHz. |
| Open with DEXTER | |
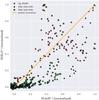 |
Fig. A.2
Normalized correlation plot of H2O+ versus 36ArH+ toward PKS 1830−211 SW, NE, and Sagittarius B2(M). The column densities of the two species have been normalized by the maximum values for each component and for each velocity channel. A perfect correlation (i.e. just a constant scaling factor between the two species) would result in clustering along the yellow line. The distributions of the two cations are poorly correlated toward the sources. The PKS 1830−211 data are from this work and from Muller et al. (in prep.) for 36ArH+ and H2O+, respectively; the corresponding Sagittarius B2(M) data are from Schilke et al. (2014) and Schilke et al. (2013). |
| Open with DEXTER | |
© ESO, 2015
Current usage metrics show cumulative count of Article Views (full-text article views including HTML views, PDF and ePub downloads, according to the available data) and Abstracts Views on Vision4Press platform.
Data correspond to usage on the plateform after 2015. The current usage metrics is available 48-96 hours after online publication and is updated daily on week days.
Initial download of the metrics may take a while.