Fig. A.1
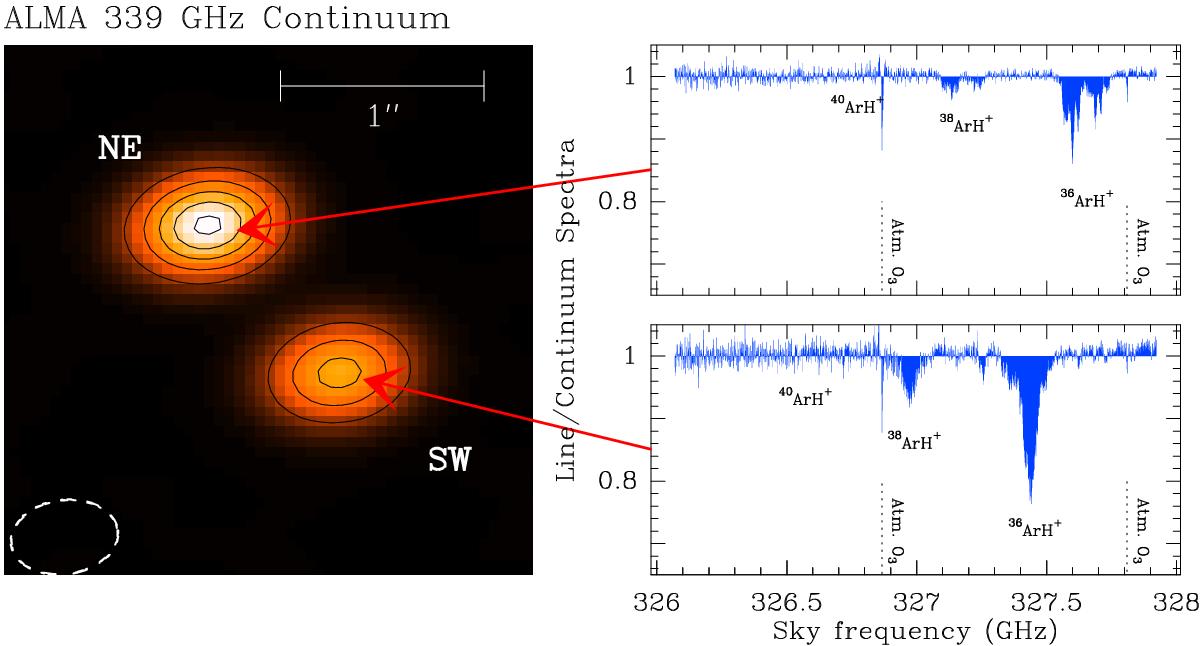
Map of the 339 GHz continuum emission of PKS 1830−211 showing the two resolved lensed images of the blazar (left). Overview of the ArH+ absorption spectrum toward PKS 1830−211 SW (bottom right) and NE (top right) from the current observations. Expected positions of the main absorption feature are indicated for 36ArH+, 38ArH+, and 40ArH+; the last is not detected. The noise increases toward lower frequencies because of the proximity of the atmospheric water line near 325.2 GHz.
Current usage metrics show cumulative count of Article Views (full-text article views including HTML views, PDF and ePub downloads, according to the available data) and Abstracts Views on Vision4Press platform.
Data correspond to usage on the plateform after 2015. The current usage metrics is available 48-96 hours after online publication and is updated daily on week days.
Initial download of the metrics may take a while.