| Issue |
A&A
Volume 582, October 2015
|
|
|---|---|---|
| Article Number | A24 | |
| Number of page(s) | 20 | |
| Section | Interstellar and circumstellar matter | |
| DOI | https://doi.org/10.1051/0004-6361/201526159 | |
| Published online | 30 September 2015 | |
Online material
Appendix A: Results for the ESE side of the nebula
Here we plot the line intensity, radial velocity, and line ratio for the simulations that are not discussed in the text. Figures A.1 and A.2 show M5V20E and M5V30E, respectively, and Figs. A.3−A.6 show results for M4V15E, M4V20E, M4V25E, and M4V30E.
 |
Fig. A.1
Hα and [N II] spectral lines from the simulation M5V20E, with Ṁ = 2 × 10⁻⁵ M⊙ yr-1, v∞ = 20 km s-1, and Fγ = 2.78 × 1010 cm-2 s-1, after 0.1 Myr of evolution. The solid lines show the simulation, and the dotted lines with points show the observations to the ESE of W26. The panels show a) line brightness; b) line ratio [N II]/Hα; and c) radial velocity of the peak emission, all as a function of distance from the star. |
| Open with DEXTER | |
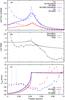 |
Fig. A.2
Hα and [N II] spectral lines from the simulation M5V30E, with Ṁ = 2 × 10⁻⁵ M⊙ yr-1, v∞ = 30 km s-1, and Fγ = 1.26 × 1010 cm-2 s-1, after 0.1 Myr of evolution. The lines and symbols are the same as in Fig. A.1. |
| Open with DEXTER | |
 |
Fig. A.3
Hα and [N II] spectral lines from the simulation M4V15E, with Ṁ = 10-4 M⊙ yr-1, v∞ = 15 km s-1, and Fγ = 3.67 × 1011 cm-2 s-1, after 0.1 Myr of evolution. The lines and symbols are the same as in Fig. A.1. |
| Open with DEXTER | |
 |
Fig. A.4
Hα and [N II] spectral lines from the simulation M4V20E, with Ṁ = 10-4 M⊙ yr-1, v∞ = 20 km s-1, and Fγ = 5.05 × 1011 cm-2 s-1, after 0.1 Myr of evolution. The lines and symbols are the same as in Fig. A.1. |
| Open with DEXTER | |
 |
Fig. A.5
Hα and [N II] spectral lines from the simulation M4V25E, with Ṁ = 10-4 M⊙ yr-1, v∞ = 25 km s-1, and Fγ = 3.10 × 1011 cm-2 s-1, after 0.1 Myr of evolution. The lines and symbols are the same as in Fig. A.1. |
| Open with DEXTER | |
 |
Fig. A.6
Hα and [N II] spectral lines from the simulation M4V30E, with Ṁ = 10-4 M⊙ yr-1, v∞ = 30 km s-1, and Fγ = 2.15 × 1011 cm-2 s-1, after 0.1 Myr of evolution. The lines and symbols are the same as in Fig. A.1. |
| Open with DEXTER | |
Appendix B: Results for the WNW side of the nebula
Here we plot the line intensity, radial velocity, and line ratio for the simulations labelled “W” in Table 1. These model the nebula Westnorthwest (WNW) from W26, in the direction of the extreme sgB[e] star W9. As noted in the text, the nebula is confined closer to W26 on this side, possibly because of the proximity of W9. The “W” simulations have larger photon fluxes than the corresponding “E” simulations, so that the ionized region penetrates deeper into the wind of the red supergiant. The results of simulations are overplotted on the observed data in Fig. B.1 for simulation M5V15W, and similarly in Figs. B.2−B.4 for M5V20W, M5V25W, and M5V30W. Figures B.5−B.8 show results for the simulations M4V15W, M4V20W, M4V25W, and M4V30W, which have a denser wind because of a larger mass-loss rate.
The observed data shows no limb-brightened peak in the nebular emission, rather just a shoulder of emission between 0.02 and 0.03 arcmin. If we discard the uncertain two points closest to zero (at W26) then the emission decreases monotonically with distance from W26, in strong constrast to the predictions of simulations. This makes the discrepency with the limb-brightened emission from M5V15W (Fig. B.1a) even larger for this side of W26. The observed line ratio is slightly lower on this side of W26, but again is relatively constant across the nebula, decreasing only outside the bright part of the nebula (θ> 0.04 arcmin). Additionally, the radial velocity of the lines (Fig. B.1c) appears too low at all radii, but particularly for θ> 0.03 arcmin.
Simulation M5V25W (Fig. B.3) has better agreement with observations, for the same reasons as M5V25E: the ionization front emission is less peaked, the radial velocity is more blueshifted in agreement with observations, and the line ratio has reasonable agreement with observations. Again, however, the crucial problem is that the observed nebular emission is all blueshifted by about 25 km s-1, whereas in the simulation the brightest emission is neither blue- nor redshifted.
 |
Fig. B.1
Hα and [N II] spectral lines from the simulation M5V15W, after 0.1 Myr of evolution. The solid lines show the simulation, and the dotted lines with points show the observations to the WNW of W26. The panels show a) line brightness; b) line ratio [N II]/Hα; and c) radial velocity of the peak emission, all as a function of distance from the star. Vertical dotted lines in panel a) show the range of radii used to set the normalisation of the simulated and observed [N II] line brightness. |
| Open with DEXTER | |
 |
Fig. B.2
Hα and [N II] spectral lines from the simulation M5V20W, with Ṁ = 2 × 10⁻⁵ M⊙ yr-1, v∞ = 20 km s-1, and Fγ = 1.29 × 1011 cm-2 s-1, after 0.1 Myr of evolution. The lines and symbols are the same as in Fig. B.1. |
| Open with DEXTER | |
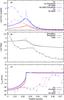 |
Fig. B.3
Hα and [N II] spectral lines from the simulation M5V25W, with Ṁ = 2 × 10⁻⁵ M⊙ yr-1, v∞ = 25 km s-1, and Fγ = 8.29 × 1010 cm-2 s-1, again after 0.1 Myr of evolution. The lines and symbols are the same as in Fig. B.1. |
| Open with DEXTER | |
 |
Fig. B.4
Hα and [N II] spectral lines from the simulation M5V30W, with Ṁ = 2 × 10⁻⁵ M⊙ yr-1, v∞ = 30 km s-1, and Fγ = 5.83 × 1010 cm-2 s-1, after 0.1 Myr of evolution. The lines and symbols are the same as in Fig. B.1. |
| Open with DEXTER | |
 |
Fig. B.5
Hα and [N II] spectral lines from the simulation M4V15W, with Ṁ = 10-4 M⊙ yr-1, v∞ = 15 km s-1, and Fγ = 1.70 × 1012 cm-2 s-1, after 0.1 Myr of evolution. The lines and symbols are the same as in Fig. B.1. |
| Open with DEXTER | |
 |
Fig. B.6
Hα and [N II] spectral lines from the simulation M4V20W, with Ṁ = 10-4 M⊙ yr-1, v∞ = 20 km s-1, and Fγ = 2.34 × 1012 cm-2 s-1, after 0.1 Myr of evolution. The lines and symbols are the same as in Fig. B.1. |
| Open with DEXTER | |
 |
Fig. B.7
Hα and [N II] spectral lines from the simulation M4V25W, with Ṁ = 10-4 M⊙ yr-1, v∞ = 25 km s-1, and Fγ = 1.44 × 1012 cm-2 s-1, after 0.1 Myr of evolution. The lines and symbols are the same as in Fig. B.1. |
| Open with DEXTER | |
 |
Fig. B.8
Hα and [N II] spectral lines from the simulation M4V30W, with Ṁ = 10-4 M⊙ yr-1, v∞ = 30 km s-1, and Fγ = 9.95 × 1011 cm-2 s-1, after 0.1 Myr of evolution. The lines and symbols are the same as in Fig. B.1. |
| Open with DEXTER | |
© ESO, 2015
Current usage metrics show cumulative count of Article Views (full-text article views including HTML views, PDF and ePub downloads, according to the available data) and Abstracts Views on Vision4Press platform.
Data correspond to usage on the plateform after 2015. The current usage metrics is available 48-96 hours after online publication and is updated daily on week days.
Initial download of the metrics may take a while.