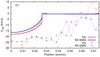
Fig. B.1

Hα and [N II] spectral lines from the simulation M5V15W, after 0.1 Myr of evolution. The solid lines show the simulation, and the dotted lines with points show the observations to the WNW of W26. The panels show a) line brightness; b) line ratio [N II]/Hα; and c) radial velocity of the peak emission, all as a function of distance from the star. Vertical dotted lines in panel a) show the range of radii used to set the normalisation of the simulated and observed [N II] line brightness.
Current usage metrics show cumulative count of Article Views (full-text article views including HTML views, PDF and ePub downloads, according to the available data) and Abstracts Views on Vision4Press platform.
Data correspond to usage on the plateform after 2015. The current usage metrics is available 48-96 hours after online publication and is updated daily on week days.
Initial download of the metrics may take a while.