| Issue |
A&A
Volume 582, October 2015
|
|
|---|---|---|
| Article Number | A3 | |
| Number of page(s) | 19 | |
| Section | Stellar structure and evolution | |
| DOI | https://doi.org/10.1051/0004-6361/201525868 | |
| Published online | 25 September 2015 | |
Online material
Appendix A: Light curve models
In the following we summarize a few basic concepts that help us understand the observed trends in our sample of Type II-P/L SNe as discussed in Sect. 3. In this chapter we first have a brief look into the different phases of a light curve (Sect. A.1) and give an overview over two analytical models for the early light curve phase by Arnett (1980, 1982) and Rabinak & Waxman (2011) (Sect. A.2). In Sect. A.3, finally, we investigate the various parameter dependencies in the models.
Appendix A.1: Light curve phases
Radiation hydrodynamic calculations of the explosion and evolution of Type II SNe have been presented by Grassberg et al. (1971), Falk & Arnett (1977), Falk (1978), Klein & Chevalier (1978), Hillebrandt & Müller (1981), and Litvinova & Nadezhin (1983, 1985), as well as more specifically for SNe II-P by Young (2004), Utrobin (2007), Utrobin & Chugai (2009), Bersten et al. (2011), and Dessart & Hillier (2011), for SNe II-L by Swartz et al. (1991) and Blinnikov & Bartunov (1993) and for the peculiar Type II-P SN 1987A by Blinnikov et al. (2000), Dessart & Hillier (2010) and Pumo & Zampieri (2011). Here we give a summary view of the physical processes at play and the various evolutionary stages seen in these simulations.
The light curve of a Type II SN can be divided into four distinct phases depending on the physical processes at play; the shock breakout phase, the cooling phase, the recombination phase, and the nebular phase (e.g. Blinnikov & Bartunov 1993; Young 2004). The first phase is the shock breakout phase, where the internal energy of the shock diffuses out to give an X-ray (extended progenitor) or gamma-ray (compact progenitor) burst. This phase lasts only for minutes or hours (Falk & Arnett 1977) and only been observed for two Type II-P SNe (SNLS-04D2dc and SNLS-06D1jd Gezari et al. 2008; Schawinski et al. 2008) and once for a Type I SN (SN 2008D, Soderberg et al. 2008).
Over the next few weeks, the ejecta expand and cool. As the post-shock temperatures are ≳106 K, hydrogen and helium are fully ionized and remain so until the temperature has decreased down to ~104 K, when recombination begins. This takes a few weeks according to models (Utrobin 2007; Bersten et al. 2011). Radiative diffusion is inefficient when compared to adiabatic cooling (Bersten et al. 2011).
The ejecta are dynamically evolving during the first few days. The adiabatic cooling accelerates the layers from their initial post-shock velocity to their final coasting velocity, which is a factor of ![]() higher (assuming equipartition between internal energy and expansion energy in the post-shock flow). The inner regions also experience strong Rayleigh-Taylor mixing that breaks spherical symmetry (Herant & Benz 1991; Müller et al. 1991).
higher (assuming equipartition between internal energy and expansion energy in the post-shock flow). The inner regions also experience strong Rayleigh-Taylor mixing that breaks spherical symmetry (Herant & Benz 1991; Müller et al. 1991).
The time scale to reach the final dynamic state is approximately the time scale of adiabatic cooling tad ~ R/v (for an adiabatically cooling, radiation dominated gas Eint ∝ R-1, where Eint is the internal energy) which is 1 day for a radius R = 1000 R⊙ and a velocity v = 104 km s-1. Thus, unless the explosion energy is very small (giving v ≪ 104 km s-1), it is a good approximation to take the ejecta as coasting for t ≳ 1 day.
Homologous expansion (v ∝ R) is achieved on a similar time scale, as it is fulfilled when R ≫ initial radius, R0, the same condition for adiabatic acceleration to be complete.
When the temperature goes below ~104 K, recombination of helium and hydrogen has to be taken into account. By ~3 weeks this begins in the outermost layers of the ejecta and gradually moves into deeper layers as a recombination and cooling wave. As the internal energy can easily escape when the gas ahead of it recombines and the opacity decreases dramatically, energy is now lost by radiation. The recombination wave effectively ploughs through the envelope, releasing internal energy at a roughly constant rate giving a plateau in the light curve.
At some point in the recombination phase, gamma-rays from 56Ni located deeper inside the ejecta start to reach the envelope layers and affect the thermal state. In particluar for the later parts of the recombination phase, this must be taken into account (Eastman et al. 1994; Kasen & Woosley 2009).
In order to achieve a linear decline, the recombination wave needs to be avoided or weakened. A sufficiently low density, for example due to a very low-mass or a very extended pre-supernova star might produce the desired effect (Blinnikov & Bartunov 1993).
After ~100 days the entire ejecta have recombined and become optically thin in the continuum. Internal energy is maintained by 56Co, which heats and ionizes the gas to keep emission lines active.
Appendix A.2: Analytical models for the cooling phase
Analytical models have the advantage of easy implementation, allowance for physical understanding, and rapid calculations over parameter-space. Analytical models for the cooling phase (~0.5–20 days) have been presented by several authors (e.g. Arnett 1980, 1982; Chugai 1991; Popov 1993; Zampieri et al. 2003; Kasen & Woosley 2009; Nakar & Sari 2010; Rabinak & Waxman 2011; Chatzopoulos et al. 2012; Nagy et al. 2014). In this article we focus on two particular models; those of Arnett (1980, 1982, hereafter A80, A82) and Rabinak & Waxman (2011, hereafter R11).
Appendix A.2.1: Arnett (1980, 1982)
Arnett (1980, 1982) presented the first analytical models for the light curves of supernovae. A80 presented models for explosion-powered light curves, whereas A82 extended these to include 56Ni (there are however also some clarifications in this paper over the use of the A80 models). This framework assumes spherical symmetry, homologous expansion, local thermodynamic equilibrium, a radiation dominated equation of state, constant opacity, and certain constraints on the density profile. The first law of thermodynamics is solved with an Eddington outer boundary condition. To obtain an analytic solution, it is postulated that the temperature profile is self-similar.
The luminosity solution for constant density (labelled “A = 0” in A809) is  (A.1)with (see Eqs. (14), (37) and (40) in Arnett 1980 and Eqs. (19) and (22) in Arnett 1982)
  (A.2)where
 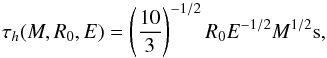 (A.3)and
  (A.4)where τ0 is the diffusion time scale at t = 0 (and therefore has no dependency on E), τh is the initial doubling time of the radius, β is a parameter that depends on the density profile (A80 shows that β ≈ 13.7 can be used for a variety of density profiles), and κ is the opacity. We have here used
 ![]() (the Arnett formulation is τh = R0/vsc, where vsc is the scaling velocity).
(the Arnett formulation is τh = R0/vsc, where vsc is the scaling velocity).
For t/τh ≪ 1, the luminosity is L(t) ≈ e− t/τ0. As τ0 is of the order of 104 days, the bolometric light curve is initially almost flat. For t/τh ≫ 1 the luminosity declines as e− t2/ (2τ0τh), where τh is the time required to reach a size of twice the progenitor size, which is of the order of 1 day. The effective temperature is computed by applying the blackbody formula to L(t) and R(t) = R0 + vsct (see Eqs. (43) and (44) in A80).
Appendix A.2.2: Rabinak & Waxman (2011)
The R11 framework starts with a specification of the progenitor density profile, and then computes post-shock density and temperature assuming a strong, radiation-dominated shock, and a analytical shock propagation formula from Matzner & McKee (1999). The ejecta are then assumed to evolve adiabatically.
The luminosity is not found from the diffusion equation as in A80, but from determining the photospheric location assuming a constant κ, taking the temperature in this layer to equal the effective temperature, and then applying the blackbody formula.
The resulting luminosity and temperature for a red supergiant progenitor (density power law index n = 3 / 2 for efficiently convective envelopes) are (see Eqs. (13) and (14) in R11):  (A.5)and
  (A.6)where E51 is the explosion energy in units of 1051 erg, R0,13 is the progenitor radius is units of 1013 cm, fρ is a parameter related to the progenitor density profiles (we use fρ = 0.1; Calzavara & Matzner 2004 find fρ = 0.079 − 0.13 for different RSG structures), κ0.34 is the opacity in units of 0.34 cm2 g-1 and t5 is the time in units of 105 s.
Appendix A.2.3: Physical approximations
Even though the aforementioned models help us in our understanding of the light curve morphology, there are limitations that need to be considered. One is the assumption of constant opacity. Full ionization and pure electron scattering give κ = 0.4 cm2 g-1 (pure hydrogen) and κ = 0.34 cm2 g-1 (solar hydrogen and helium mixture). These are reasonable estimates at early times, although free-free absorption may contribute as well (Rogers & Iglesias 1992). At later times recombination reduces the electron scattering opacity but line blocking makes significant contributions (Karp et al. 1977).
As mentioned above the ejecta are dynamicaly evolving in the cooling phase, which is not considered in these models. The outer layers of relevance do, however, only accelerate by a factor of ![]() so this effect should not be strong.
so this effect should not be strong.
Weak or moderate mixing of 56Ni has no influence for Type II-P light curves during the first weeks (Kasen & Woosley 2009). However, if there would be very strong mixing, 56Ni bullets shot into the outer envelope could have an impact on the cooling phase. 56Ni becomes important earlier for more compact progenitors (e.g. for SN 1987A, with R0 = 50 R⊙, the 56Ni-driven second peak began already after a week; Blinnikov et al. 2000). This limits the applicability of the models to radii ≳100 R⊙.
There is mounting evidence that the SN explosion mechanism is asymmetric, and that the metal cores obtain highly asymmetric shapes (e.g. Kjær et al. 2010; Larsson et al. 2013; Grefenstette et al. 2014). However, the shocks tends to spherize at larger mass coordinate, and the outer layers of interest here are likely close to spherical symmetry (e.g. Leonard et al. 2001, 2006).
A radiation dominated equation of state should be an excellent approximation for these early phases (A82). The R11 models have more realistic density profiles and photospheric position than A80, on the other hand they do not include radiative diffusion which A80 does.
Appendix A.3: Parameter dependencies in the models
Here we discuss the influence of model parameters M, E, and R0 on light curve properties (bolometric and optical rise times and peak luminosities).
Appendix A.3.1: Radius
The dependency of the bolometric luminosity on the progenitor radius is L ∝ R0 both in the A80 and the R11 model. A larger radius leads to higher luminosity because adiabatic losses are smaller and more of the explosion energy is retained at any given time.
Both in A80 and R11, larger R0 also leads to brighter optical peaks, driven by the dependency of Lbol. A larger R0 additionally means it takes longer to rise to optical peak, which counteracts this, but not enough to reverse the trend.
The optical light curve can be thought of as the bolometric light curve multiplied by the fraction of the bolometric light that emerges in the optical: ![]() (A.7)The first function we have explicit equations for, the second is computed from the photospheric temperature. The optical peak will be the peak of fopt(t), shifted to a somewhat earlier time by the monotonically decreasing Lbol(t) function. Under the assumption of constant opacity, the fopt function depends only on the photospheric temperature, which in turn depends on Lbol(t) and Rphot(t). For R ≫ R0, fopt(t) depends on R0 only through its influence on Lbol.
(A.7)The first function we have explicit equations for, the second is computed from the photospheric temperature. The optical peak will be the peak of fopt(t), shifted to a somewhat earlier time by the monotonically decreasing Lbol(t) function. Under the assumption of constant opacity, the fopt function depends only on the photospheric temperature, which in turn depends on Lbol(t) and Rphot(t). For R ≫ R0, fopt(t) depends on R0 only through its influence on Lbol.
As exemplified by the R11 models, the bolometric luminosity follows ![]() and changes on a time scale of τL = L/ dL/ dt = 6.3 t. For our typical rise times of 5–15 days, the bolometric luminosity thus changes on a time scale of 32–95 days. The temperature instead changes on a faster time scale τT = Tph/ dTph/ dt = 2.2 t corresponding to 11–33 days for our typical rise times. The time scales in the A80 formalism show similar relations. This means that the optical light curve peak must lie close in time to the peak in fopt.
and changes on a time scale of τL = L/ dL/ dt = 6.3 t. For our typical rise times of 5–15 days, the bolometric luminosity thus changes on a time scale of 32–95 days. The temperature instead changes on a faster time scale τT = Tph/ dTph/ dt = 2.2 t corresponding to 11–33 days for our typical rise times. The time scales in the A80 formalism show similar relations. This means that the optical light curve peak must lie close in time to the peak in fopt.
We define optical as the 4000–8000 Å range. Fig. A.1 shows fopt for this range as a function of T. fopt peaks when Tphot ≈ 7000 K. Indeed, we find that for the A80/A82 model the rise to optical peak mostly ends at temperatures between 6400 and 7200 K, and for the R11 model at temperatures between 7500 and 7900 K for a range of parameters (see Sect. 3.2 for the exact parameter space).
 |
Fig. A.1
Fraction of the of the bolometric light, Lopt, that emerges in the optical (4000–8000 Å). fopt peaks when Tphot ≈ 7000 K (dotted line). |
| Open with DEXTER | |
We further assume the peak of Lopt is close to the peak of fopt, and R ≫ R0. Then 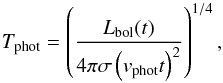 (A.8)where vphot is the photospheric velocity and σ is the Stefan-Boltzmann constant. As Lbol = CR0EM-1exp( − t2/ (2τ0τh)) for t ≫ τh (Arnett 1980) and
 ![]() , we get for t ≪ 2τ0τh
, we get for t ≪ 2τ0τh (A.9)where C = 5.2 × 10¹¹ g cm-1 s-1 for κ = 0.4 cm2 g-1. It thus takes longer to reach 7000 K (or any other temperature) for a larger R0 because R0 increases the scale of Lbol. The dependency on M and E drops out, as Lbol and
 ![]() both depend in the same way on them (∝E/M); in this way we can understand why E and M are not strong drivers of the optical rise times in the models (see Figs. 9a and b in Sect. 3).
both depend in the same way on them (∝E/M); in this way we can understand why E and M are not strong drivers of the optical rise times in the models (see Figs. 9a and b in Sect. 3).
We can solve this equation for the rise time: 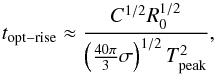 (A.10)and we get
  (A.11)The R11 model gives (solving Tphot(t) = Tpeak):
  (A.12)The dependencies are similar to the ones derived for A80; we note the weak dependencies on E and M.
With these formulas we can understand why redder bands peak later; they have lower Tpeak. We now also have a quantitative handle on the dependency on R0; it is a square root dependency which fits reasonably well with the full solutions (see Figs. 9a and b in Sect. 3). Using hydrodynamical simulations Swartz et al. (1991) also find that larger progenitor radii result in supernovae with longer rise times and brighter optical peaks (B-band). However, as these authors discuss, significant He enrichment of the envelope could have a similar effect to smaller envelope masses in that the light curve will peak earlier, be brighter, and still have a linear decline. The reason is that helium has a lower opacity than hydrogen and therefore the energy trapping is less effective. This means that in principle the observed brightness for SNe II-L might also be explained by a He-rich envelope. In our parameter study we assume a constant opacity, κ, and therefore cannot account for such effects.
Appendix A.3.2: Mass and explosion energy
The dependency of the bolometric luminosity on mass is L ∝ M-1 and L ∝ M-0.84 in the A80 and R11 models, respectively. A higher mass reduces the peak luminosity as it is more difficult for photons to diffuse out of more massive ejecta. Swartz et al. (1991) also find that higher mass envelopes result in supernovae with dimmer optical peaks (B-band).
The dependency of the bolometric luminosity on energy is L ∝ E in the A80 model, and L ∝ E0.92 in the R11 model. A higher energy leads to higher peak luminosity for two reasons; more internal energy is created in the ejecta, and it can diffuse out more rapidly as higher E leads to higher velocities and lower density. On the other hand, higher velocities also lead to stronger adiabatic losses, so the final outcome is not obvious. The analytic solutions show that the first effects dominate.
If we ignore the first day or so when the progenitor size affects the time scales, the diffusion time in A80 is ![]() (A.13)Higher mass leads to longer light curves, as it takes longer for the energy to diffuse out. Energy has a relatively weak influence, but higher energy leads to faster light curves as photon escape and adiabatic degrading occur faster.
(A.13)Higher mass leads to longer light curves, as it takes longer for the energy to diffuse out. Energy has a relatively weak influence, but higher energy leads to faster light curves as photon escape and adiabatic degrading occur faster.
Higher mass also leads to dimmer optical peaks (both models). Higher M scales down Lbol (see above), and this typically has a stronger impact than the slower decline rate obtained from a longer τ0τh. A higher explosion energy, instead, gives brighter optical peaks. This is driven by the influence of E on Lbol, as the evolution of Tphot only weakly depends on E.
Regarding rise time, A80 gives somewhat longer rise times with higher M and lower E (the weak dependency is absent in our approximate formula (A.11)), whereas R11 gives shorter ones. One difference between these models is that the photosphere is fixed in mass coordinate in A80, but moves inwards in R11. In A80 a lower E/M gives higher τ0τh which means it takes longer to reach Tpeak (through the exponential factor in Eq. (A.1)). The dependence of the rise time on mass and explosion energy, however, is smaller than the dependence on the radius, as we can see in Eq. (A.11). In fact our estimate for the rise time shows that to first order, the effects of mass and energy on the rise time is negligible.
Appendix B: Additional tables
Table B.1 lists the local sequence stars from the SDSS DR9 catalogue that were used to calibrate the LT and LCOGT g′r′i′-band
Optical sequence stars.
r′/R-band properties of comparison SNe.
photometry of LSQ13cuw to the SDSS system (see also Sect. 2.1).
Table B.2 shows r′/R-band properties of SNe that were not included in our II-P/L sample, but are shown in Figs. 8 and 9 for comparison.
© ESO, 2015
Current usage metrics show cumulative count of Article Views (full-text article views including HTML views, PDF and ePub downloads, according to the available data) and Abstracts Views on Vision4Press platform.
Data correspond to usage on the plateform after 2015. The current usage metrics is available 48-96 hours after online publication and is updated daily on week days.
Initial download of the metrics may take a while.