| Issue |
A&A
Volume 581, September 2015
|
|
|---|---|---|
| Article Number | A122 | |
| Number of page(s) | 13 | |
| Section | Interstellar and circumstellar matter | |
| DOI | https://doi.org/10.1051/0004-6361/201526468 | |
| Published online | 21 September 2015 | |
Online material
Appendix A: Calculation of nuclear spin branching ratios using symmetry rules
The method used in deriving the nuclear spin branching ratios is demonstrated by three examples, all dealing with varieties of the reaction ![]()
![]()
![]() . The method is described in Quack (1977) and in Park & Light (2007b). The collision partners are classified, or labeled, according to the irreducible representations of an appropriate permutation group. These labels tell how the symmetrized nuclear spin functions belonging to this species transform under operations of the group, such as the transposition of two identical nuclei and the permutation of n identical nuclei (e.g., Bunker & Jensen 2006). The branching ratios are obtained from correlations between the group of the intermediate reaction complex and the direct product groups representing the reactants and products (Quack 1977). The statistical weight of each channel corresponds to the number of nuclear spin functions belonging to that symmetry species.
. The method is described in Quack (1977) and in Park & Light (2007b). The collision partners are classified, or labeled, according to the irreducible representations of an appropriate permutation group. These labels tell how the symmetrized nuclear spin functions belonging to this species transform under operations of the group, such as the transposition of two identical nuclei and the permutation of n identical nuclei (e.g., Bunker & Jensen 2006). The branching ratios are obtained from correlations between the group of the intermediate reaction complex and the direct product groups representing the reactants and products (Quack 1977). The statistical weight of each channel corresponds to the number of nuclear spin functions belonging to that symmetry species.
Appendix A.1: Three identical nuclei
As the first example we consider the reaction D2H+ + NH2D →![]()
![]() . The H and D symmetries are treated separately. The same result is obtained by considering the mixed system in appropriate direct product groups. From the hydrogen point of view, H2 and H form H3 which dissociates back to H2 + H. On the deuterium side, the reaction forms D3 from D2 + D. In the present model we assume that the branching ratios are equal to the pure nuclear spin symmetry induction and subduction statistical weights, which for these reactions can be read from Tables 3 and 4 of Hugo et al. (2009). We reproduce the appropriate tables in Table A.1.
. The H and D symmetries are treated separately. The same result is obtained by considering the mixed system in appropriate direct product groups. From the hydrogen point of view, H2 and H form H3 which dissociates back to H2 + H. On the deuterium side, the reaction forms D3 from D2 + D. In the present model we assume that the branching ratios are equal to the pure nuclear spin symmetry induction and subduction statistical weights, which for these reactions can be read from Tables 3 and 4 of Hugo et al. (2009). We reproduce the appropriate tables in Table A.1.
Statistical nuclear spin branching ratios for reactions ![]() and
and ![]() .
.
The numbers in the leftmost columns of Table A.1 are the frequencies of the irreducible representations A1, A2, and E, in the representations of the permutation group S3 generated by the nuclear spin functions of ![]() and
and ![]() . This means that the symmetry representations of H3 and D3 in S3 can be reduced into the following direct sums (denoted by ⊕):
. This means that the symmetry representations of H3 and D3 in S3 can be reduced into the following direct sums (denoted by ⊕): ![]() (A.1)(e.g., Bunker & Jensen 2006; Hugo et al. 2009). According to Mulliken’s notation used here, one-dimensional representations are labeled as either A or B, two-dimensional ones are labeled E, three-dimensional F, four-dimensional G, etc. The total nuclear spin statistical weight of each symmetry species can be read from these decompositions by multiplying the frequency by the dimension of the representation, f(Γi) × dim(Γi). The Greek appellations, para, meta, and ortho are used to indicate these statistical weights for the simplest molecules, so that “ortho” has the highest statistical weight. The “para” (E, I = 1/2) and “ortho” (A1, I = 3/2) species of
(A.1)(e.g., Bunker & Jensen 2006; Hugo et al. 2009). According to Mulliken’s notation used here, one-dimensional representations are labeled as either A or B, two-dimensional ones are labeled E, three-dimensional F, four-dimensional G, etc. The total nuclear spin statistical weight of each symmetry species can be read from these decompositions by multiplying the frequency by the dimension of the representation, f(Γi) × dim(Γi). The Greek appellations, para, meta, and ortho are used to indicate these statistical weights for the simplest molecules, so that “ortho” has the highest statistical weight. The “para” (E, I = 1/2) and “ortho” (A1, I = 3/2) species of ![]() have, however, equal statistical weights.
have, however, equal statistical weights. ![]() has no nuclear spin functions of species A2, which is antisymmetric with respect to interchange of two nuclei4. H2 and D2 can have the symmetries A or B, and the single nuclei H and D have the A symmetry. The number in the bottom righthand corner of each table gives the total number of linearly independent nuclear spin functions of the molecule, (2I + 1)3, where I = 1/2 for H3 and I = 1 for D3. The branching ratios in Table A.1 are obtained by multiplying the correlation table between S3 and the product group S2 ⊗ S1 by appropriate frequencies. This correlation table is given by
has no nuclear spin functions of species A2, which is antisymmetric with respect to interchange of two nuclei4. H2 and D2 can have the symmetries A or B, and the single nuclei H and D have the A symmetry. The number in the bottom righthand corner of each table gives the total number of linearly independent nuclear spin functions of the molecule, (2I + 1)3, where I = 1/2 for H3 and I = 1 for D3. The branching ratios in Table A.1 are obtained by multiplying the correlation table between S3 and the product group S2 ⊗ S1 by appropriate frequencies. This correlation table is given by
| S 3 | S2 ⊗ S1 | |
| A ⊗ A | B ⊗ A | |
|
|
||
| A 1 | 1 | 0 |
| A 2 | 0 | 1 |
The correlation table S3 ↔ S2 ⊗ S1 presented above is derived using the standard methods of group theory, i.e., by forming the character table of direct product group S2 ⊗ S1, and the character table for the subduced representations of S3 on S2 ⊗ S1, S3 ↓ S2 ⊗ S1. The latter is obtained from that of S3 by stripping it from operations that are unfeasible in the direct product group S2 ⊗ S1, i.e., the class of cyclic permutations of three nuclei, {(123),(132)}. Finally, the orthogonality relation between the characters of irreducible representations is used.
Tables A.1 can be read either from left to right (“subduction”) or top down (“induction”). For example, one can see that the A1 species of H3 and D3 dissociate exclusively to the A symmetry of H2 or D2, whereas the E species dissociate to both A and B symmetries (“ortho” and “para”, respectively) of H2 or D2 with equal probability. In the reaction oD2 + D (A ⊗ A), the A1 (“meta”) and E (“ortho”) species of D3 are formed with the probabilities 10/18 and 8/18, respectively, whereas in the reaction pD2 + D (B ⊗ A), the A2 (“para”) and E (“ortho”) species of D3 are formed with the probabilities 1/9 and 8/9. These branching ratios determine relative abundances of ![]() ,
, ![]() , and
, and ![]() resulting from the reaction D2H+ + NH2D.
resulting from the reaction D2H+ + NH2D.
Appendix A.2: Six identical nuclei
To determine the nuclear spin branching ratios of the reactions ![]()
![]()
![]() and
and ![]()
![]()
![]() , one needs to determine the nuclear spin symmetry species of H6 and D6 in the permutation group S6. We first calculate the characters, χ(R), of the representations generated by the nuclear spin functions of H6 and D6 under the operations R of S6. Crabtree & McCall (2013) give a convenient formula for this:
, one needs to determine the nuclear spin symmetry species of H6 and D6 in the permutation group S6. We first calculate the characters, χ(R), of the representations generated by the nuclear spin functions of H6 and D6 under the operations R of S6. Crabtree & McCall (2013) give a convenient formula for this: ![]() (A.2)where I is the nuclear spin (1/2 for H and 1 for D), n the number of identical nuclei (here 6), and x the number of transpositions or pairwise permutations, which correspond to the operation R. The number of interchanges corresponding to a cyclic permutation of k elements is k − 1, and so x = k − 1. For example, x = 2 for the ternary permutation (123). The character table of S6 is easily obtainable using GAP (2015). By applying the orthogonality relation of the characters of irreducible representations, we derive the following decompositions for the symmetry representations of H6 and D6:
(A.2)where I is the nuclear spin (1/2 for H and 1 for D), n the number of identical nuclei (here 6), and x the number of transpositions or pairwise permutations, which correspond to the operation R. The number of interchanges corresponding to a cyclic permutation of k elements is k − 1, and so x = k − 1. For example, x = 2 for the ternary permutation (123). The character table of S6 is easily obtainable using GAP (2015). By applying the orthogonality relation of the characters of irreducible representations, we derive the following decompositions for the symmetry representations of H6 and D6: 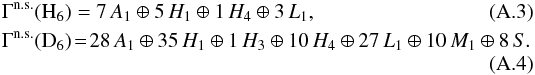 The correlation tables S6 ↔ S3 ⊗ S3 and S6 ↔ S4 ⊗ S2 needed for the induction and subduction statistics are derived as outlined in the previous example. Finally, the branching ratio tables listed in Tables A.2−A.5 are obtained by multiplying the correlation tables by the frequencies of irreducible representations appearing in the decompositions given above. In addition, the columns of the correlation table are multiplied by the dimensions of the subduced representations in order to make the weights correspond to the total number of nuclear spin functions belonging to each representation. In the previous example, all products had one-dimensional representations. The correct normalization of the weights can be checked by inspecting the last rows and columns of the tables. In these tables, species with zero frequencies are not listed.
Statistical nuclear spin branching ratios of the reaction ![]() .
.
Statistical nuclear spin branching ratios of the reaction ![]() .
.
Statistical nuclear spin branching ratios of the reaction ![]() .
.
Statistical nuclear spin branching ratios of the reaction ![]() .
.
The use of the branching ratio tables is illustrated in Figs. A.1 and A.2. Figure A.1 gives the outcome of the reaction ![]() assuming that one of the molecules is of the A1 (“ortho”) symmetry and the other one is E (“para”). The branching probabilities indicated next to the arrows are obtained from Tables A.2 (reading it top down) and from Table A.3 (reading it from left to right). After combining the probabilities of pathways leading to different symmetry species of
assuming that one of the molecules is of the A1 (“ortho”) symmetry and the other one is E (“para”). The branching probabilities indicated next to the arrows are obtained from Tables A.2 (reading it top down) and from Table A.3 (reading it from left to right). After combining the probabilities of pathways leading to different symmetry species of ![]() , one finds that the F1, A1, and E species are formed in ratios 15:7:2 in this reaction. Figure A.2 describes the branching of the reaction
, one finds that the F1, A1, and E species are formed in ratios 15:7:2 in this reaction. Figure A.2 describes the branching of the reaction ![]() assuming that both species are A1 (“meta”). The branching ratios are obtained from Tables A.4 and A.5. This reaction produces the F1, A1, and E species of
assuming that both species are A1 (“meta”). The branching ratios are obtained from Tables A.4 and A.5. This reaction produces the F1, A1, and E species of ![]() in ratios 9:9:2.
in ratios 9:9:2.
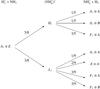 |
Fig. A.1
Branching ratios of the reaction |
| Open with DEXTER | |
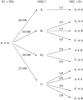 |
Fig. A.2
Branching ratios of the reaction |
| Open with DEXTER | |
© ESO, 2015
Current usage metrics show cumulative count of Article Views (full-text article views including HTML views, PDF and ePub downloads, according to the available data) and Abstracts Views on Vision4Press platform.
Data correspond to usage on the plateform after 2015. The current usage metrics is available 48-96 hours after online publication and is updated daily on week days.
Initial download of the metrics may take a while.