| Issue |
A&A
Volume 581, September 2015
|
|
|---|---|---|
| Article Number | A91 | |
| Number of page(s) | 7 | |
| Section | Interstellar and circumstellar matter | |
| DOI | https://doi.org/10.1051/0004-6361/201526428 | |
| Published online | 11 September 2015 | |
Online material
Appendix A: CO channel maps
We show in Fig. A.1 the channel maps of the blue- and red-shifted ALMA CO(2−1) (continuum subtracted) emission towards VLA1623, which are analysed and discussed in the main text (see Sect. 3). The images clearly show two gas components that are well separated in velocity: a red-shifted cavity-like structure dominating the emission at low projected velocities (Ar1, Ar2, and Ar3 knots); and a collimated emission in the
higher-velocity channels (Br2, Br1, Bb1, and Bb2 knots along the cyan line) and associated with the closest [Oi] 63 μm peaks (see Fig. 1). In particular, compact high-velocity outflow emission is detected close to source B (Bb1 and Br1 knots). The channel maps of the blue- and red-shifted SMA CO(3−2) emission are also presented in Fig. A.2 for comparison. We note that the low-velocity blue-shifted emission between 0 and +3 km s-1 is resolved by the ALMA observations.
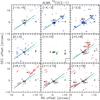 |
Fig. A.1
Channel maps of the ALMA CO(2−1) emission. The velocity range of each map is indicated in the top left corner. The ALMA synthesised beam of the CO map is shown in the central panel. Contour levels of emission are traced at 3, 5, and 10σ levels and increase in steps of 10σ. Negative contours are displayed in black starting at 3σ level and decreasing in steps of 3σ. Black crosses represent the three protostars, which are labelled in the central panel. Other labels indicate the CO features discussed in the text (see also Fig. 2). Black and cyan solid lines are the same as in Fig. 1. The ALMA observations resolve the low-velocity blue-shifted emission (0, +3 km s-1) detected with SMA (see Fig. A.2), which is possibly associated with extended emission and, therefore, filtered out by our high-resolution ALMA interferometric observations. |
| Open with DEXTER | |
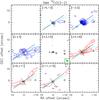 |
Fig. A.2
Channel maps of the SMA CO(3−2) emission. The velocity range of each map is indicated in the top left corner. The SMA synthesised beam of 2 |
| Open with DEXTER | |
© ESO, 2015
Current usage metrics show cumulative count of Article Views (full-text article views including HTML views, PDF and ePub downloads, according to the available data) and Abstracts Views on Vision4Press platform.
Data correspond to usage on the plateform after 2015. The current usage metrics is available 48-96 hours after online publication and is updated daily on week days.
Initial download of the metrics may take a while.