Fig. A.1
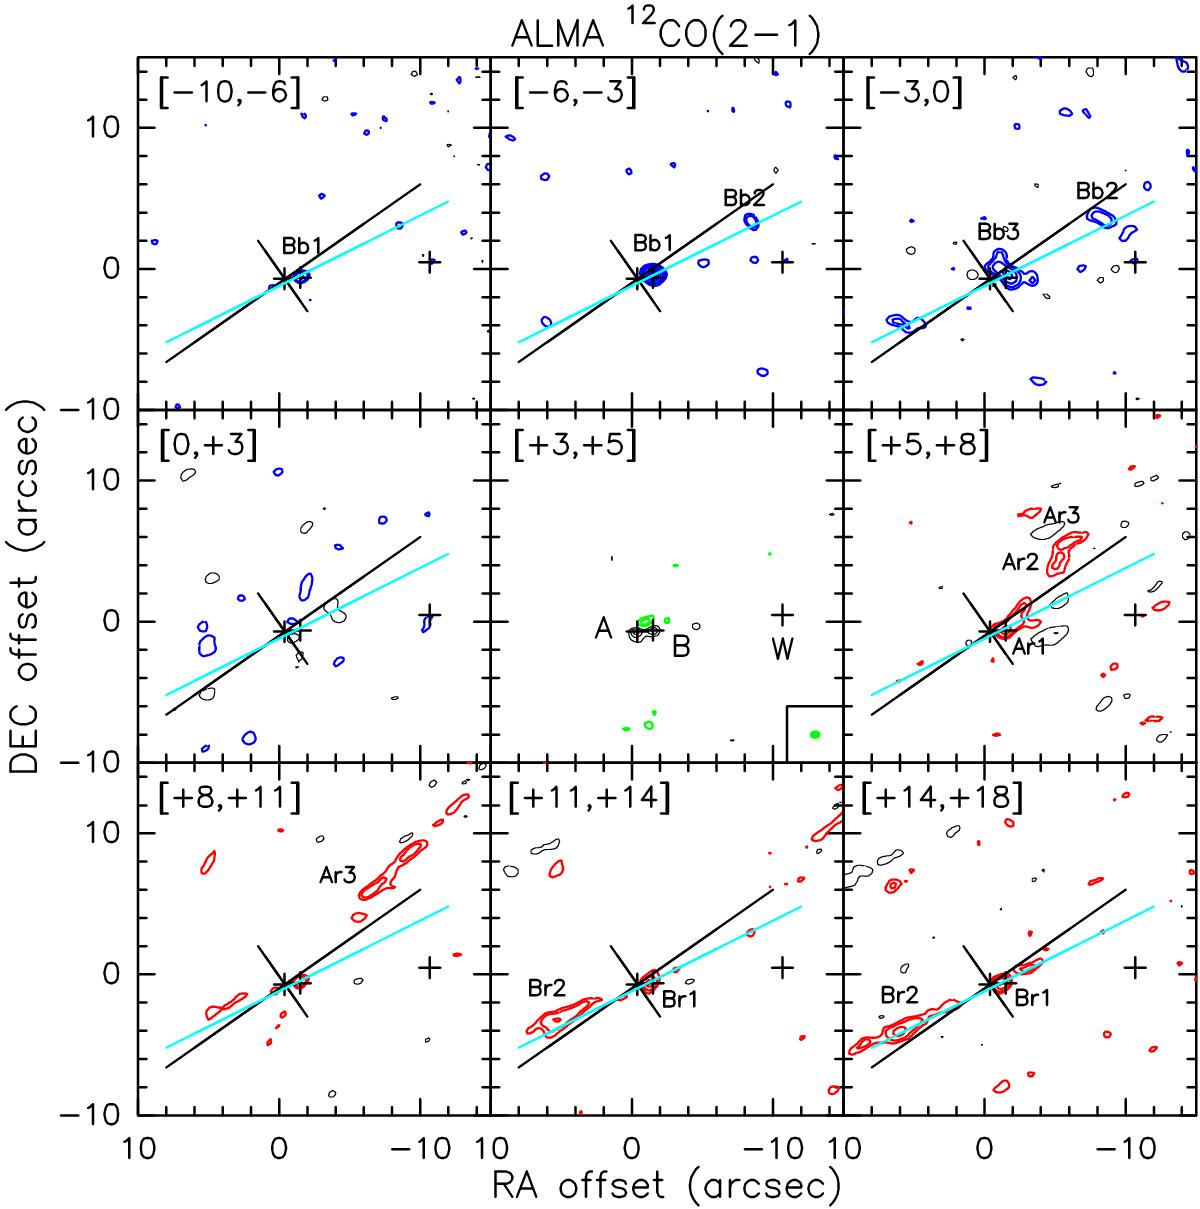
Channel maps of the ALMA CO(2−1) emission. The velocity range of each map is indicated in the top left corner. The ALMA synthesised beam of the CO map is shown in the central panel. Contour levels of emission are traced at 3, 5, and 10σ levels and increase in steps of 10σ. Negative contours are displayed in black starting at 3σ level and decreasing in steps of 3σ. Black crosses represent the three protostars, which are labelled in the central panel. Other labels indicate the CO features discussed in the text (see also Fig. 2). Black and cyan solid lines are the same as in Fig. 1. The ALMA observations resolve the low-velocity blue-shifted emission (0, +3 km s-1) detected with SMA (see Fig. A.2), which is possibly associated with extended emission and, therefore, filtered out by our high-resolution ALMA interferometric observations.
Current usage metrics show cumulative count of Article Views (full-text article views including HTML views, PDF and ePub downloads, according to the available data) and Abstracts Views on Vision4Press platform.
Data correspond to usage on the plateform after 2015. The current usage metrics is available 48-96 hours after online publication and is updated daily on week days.
Initial download of the metrics may take a while.