| Issue |
A&A
Volume 580, August 2015
|
|
|---|---|---|
| Article Number | L7 | |
| Number of page(s) | 9 | |
| Section | Letters | |
| DOI | https://doi.org/10.1051/0004-6361/201526474 | |
| Published online | 07 August 2015 | |
Online material
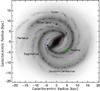 |
Fig. 2
Position of the IRDCs in the Galaxy (Courtesy of NASA/JPL-Caltech): G336.9, G337.1, and G337.2 are indicated by a blue circle, G010.4 and G018.7 by a red and a green one. The position of the Sun is also indicated. |
| Open with DEXTER | |
Appendix A
Observed molecular transitions.
Coordinates and basic aspects of the five IRDCs.
Overview of the physical properties of the IRDCs.
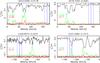 |
Fig. A.1
Black: HIFI spectra of the para-H2O ground-state absorption line at 1113.343 GHz for the line of sight towards G010.4 (top left), G018.7 (top right), G336.9 (bottom left), and G337.2 (bottom right). Green: FLASH CO(3−2) spectra, rescaled dividing by 50 and shifted by the amount indicated in green on the left. Red: C17O(3−2) spectrum, rescaled dividing by 16 and shifted by the amount indicated in red on the left. The tangential velocity (± 10 km s-1, dashed) is indicated in blue. |
| Open with DEXTER | |
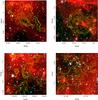 |
Fig. A.2
GLIMPSE false-colour images (red: 8 μm, green: 4.5 μm, blue: 3.6 μm) of G010.4 a), G018.7 b), G336.9 c), G337.2 d). The yellow contours show the 870 μm emission from the ATLASGAL survey, ranging from 0.14 to 1.59 Jy beam-1 in equal log steps of 0.15 dex in a); from 0.14 to 3.98 Jy beam-1 in equal log steps of 0.16 dex in b); from 0.14 to 1.12 Jy beam-1 in equal log steps of 0.15 dex in c); and from 0.15 to 1.91 Jy beam-1 in equal log steps of 0.16 dex in d). The red plus indicates the position of the molecular-line observations. |
| Open with DEXTER | |
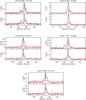 |
Fig. A.3
High-density tracers observed with Mopra. The source name is indicated above each panel. For each source, the HCO+(1−0) (black) and H13CO+(1−0) (red) spectra are shown in the top sub-panel, whereas the HNC(1−0) (black) and HN13C(1−0) (red) spectra are shown in the bottom sub-panel. The VLSR of the source is indicated in blue. |
| Open with DEXTER | |
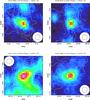 |
Fig. A.4
MALT90 HCO+(1−0) zeroeth moment map (contours) superimposed on the ATLASGAL sub-mm continuum emission at 870 μm (colourscale) for G010.4 (top left), G336.9 (top right), G337.1 (bottom left), and G337.2 (bottom right). The Mopra and APEX beam sizes are indicated. |
| Open with DEXTER | |
© ESO, 2015
Current usage metrics show cumulative count of Article Views (full-text article views including HTML views, PDF and ePub downloads, according to the available data) and Abstracts Views on Vision4Press platform.
Data correspond to usage on the plateform after 2015. The current usage metrics is available 48-96 hours after online publication and is updated daily on week days.
Initial download of the metrics may take a while.