Fig. A.3
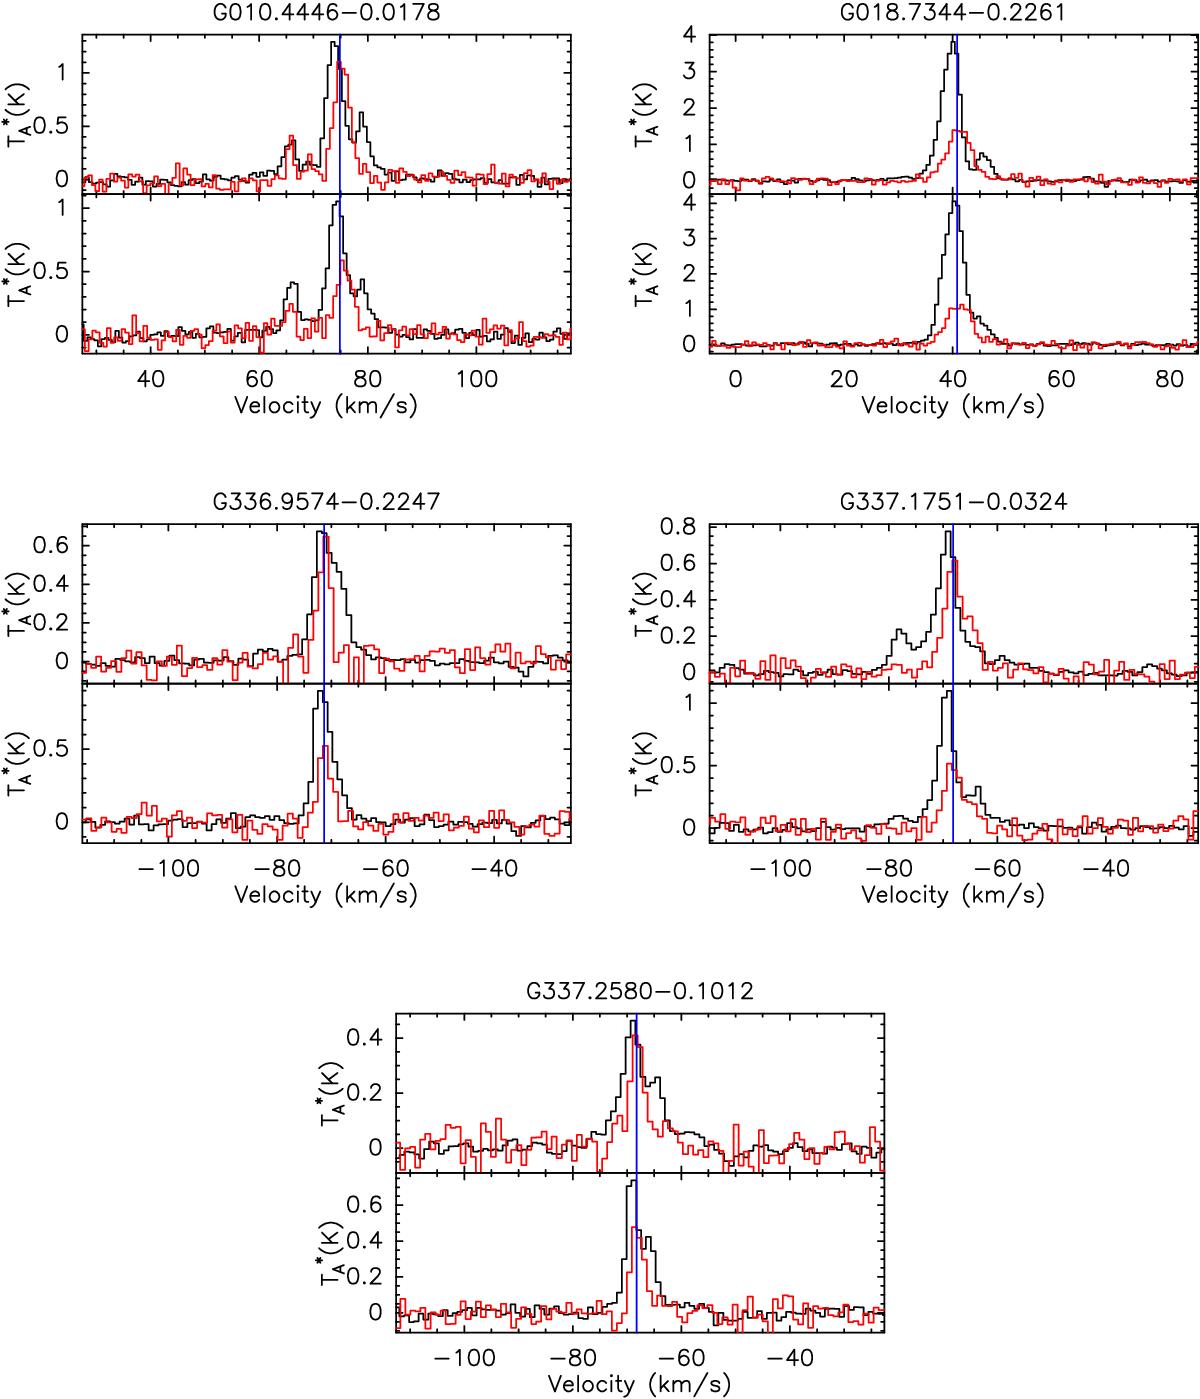
High-density tracers observed with Mopra. The source name is indicated above each panel. For each source, the HCO+(1−0) (black) and H13CO+(1−0) (red) spectra are shown in the top sub-panel, whereas the HNC(1−0) (black) and HN13C(1−0) (red) spectra are shown in the bottom sub-panel. The VLSR of the source is indicated in blue.
Current usage metrics show cumulative count of Article Views (full-text article views including HTML views, PDF and ePub downloads, according to the available data) and Abstracts Views on Vision4Press platform.
Data correspond to usage on the plateform after 2015. The current usage metrics is available 48-96 hours after online publication and is updated daily on week days.
Initial download of the metrics may take a while.