| Issue |
A&A
Volume 580, August 2015
|
|
|---|---|---|
| Article Number | A109 | |
| Number of page(s) | 19 | |
| Section | Planets and planetary systems | |
| DOI | https://doi.org/10.1051/0004-6361/201526108 | |
| Published online | 11 August 2015 | |
Online material
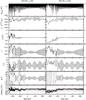 |
Fig. 2
Comparative short-term dynamical evolution of various parameters for two representative examples of orbits that are the most different from the nominal one of 2012 FC71 (± 3σ deviations, see text for details). The distance from the Earth (panel A)); the value of the Hill sphere radius of the Earth, 0.0098 AU, is shown (red line). The parameter |
| Open with DEXTER | |
 |
Fig. 3
Same as Fig. 2 but for ± 9σ (see text for details). |
| Open with DEXTER | |
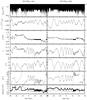 |
Fig. 5
Same as Fig. 2 but for 2014 EK24 and ± 6σ (see text for details). |
| Open with DEXTER | |
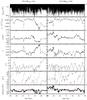 |
Fig. 7
Same as Fig. 2 but for 2014 QD364 and ± 9σ (see text for details). |
| Open with DEXTER | |
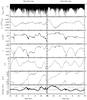 |
Fig. 9
Same as Fig. 2 but for 2014 UR and ± 6σ (see text for details). |
| Open with DEXTER | |
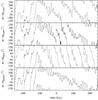 |
Fig. 11
Time evolution of ωr relative to Venus, the Earth, Mars, and Jupiter for 2012 FC71. |
| Open with DEXTER | |
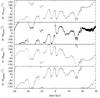 |
Fig. 13
Same as Fig. 11 but for 2014 EK24. |
| Open with DEXTER | |
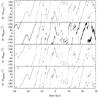 |
Fig. 15
Same as Fig. 11 but for 2014 QD364. |
| Open with DEXTER | |
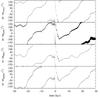 |
Fig. 17
Same as Fig. 11 but for 2014 UR. |
| Open with DEXTER | |
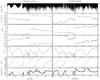 |
Fig. 18
Same as Fig. 1 but for 2014 XX39 and Hayabusa 2 (see text for details). |
| Open with DEXTER | |
Heliocentric Keplerian orbital elements of 2014 XX39.
Appendix A: Average short-term evolution of 2012 FC71, 2014 EK24, 2014 QD364, and 2014 UR
Figures A.1 to A.4 show the short-term evolution of the orbital elements a, e, i, Ω, and ω of the objects studied here. The thick black curves show the average results of the evolution of 100 control orbits computed as described in Sect. 2. The thin red curves show the ranges (minimum and maximum) in the values of the parameters at a given time. Asteroid 2012 FC71 is the most dynamically stable of the four objects, followed by 2014 EK24; 2014 UR is quite unstable and the least stable is 2014 QD364. Asteroid 2014 QD364 has an e-folding time, or characteristic timescale on which two arbitrarily close orbits diverge exponentially, of a few dozen years. In sharp contrast, the e-folding time of 2014 EK24 is several hundred years. Surprisingly, the e-folding time of 2014 EK24 is somewhat longer than that of 2012 FC71, even if its orbital evolution is significantly less stable.
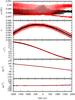 |
Fig. A.1
Time evolution of the orbital elements a, e, i, Ω, and ω of 2012 FC71. The thick curve shows the average evolution of 100 control orbits, the thin curves show the ranges in the values of the parameters at the given time. |
| Open with DEXTER | |
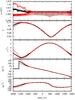 |
Fig. A.2
Same as Fig. A.1 but for 2014 EK24. |
| Open with DEXTER | |
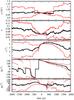 |
Fig. A.3
Same as Fig. A.1 but for 2014 QD364. |
| Open with DEXTER | |
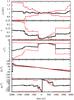 |
Fig. A.4
Same as Fig. A.1 but for 2014 UR. |
| Open with DEXTER | |
© ESO, 2015
Current usage metrics show cumulative count of Article Views (full-text article views including HTML views, PDF and ePub downloads, according to the available data) and Abstracts Views on Vision4Press platform.
Data correspond to usage on the plateform after 2015. The current usage metrics is available 48-96 hours after online publication and is updated daily on week days.
Initial download of the metrics may take a while.