| Issue |
A&A
Volume 580, August 2015
|
|
|---|---|---|
| Article Number | A82 | |
| Number of page(s) | 33 | |
| Section | Interstellar and circumstellar matter | |
| DOI | https://doi.org/10.1051/0004-6361/201525970 | |
| Published online | 06 August 2015 | |
Online material
Appendix A: Observations and summary tables
Observations during EX Lupi quiescence analysed in this paper.
Periodic signals in the emission line radial velocities.
Non-blended, narrow emission lines observed in EX Lupi, based on line identifications by SA12, and using the atomic constants from the NIST database.
Appendix B: Disk properties of EX Lupi revisited
Starting with the SED from Sipos et al. (2009), we have fitted the spectral energy distribution (SED) using the RADMC code (Dullemond & Dominik 2004). The star is highly variable in the optical and IR, and most of the data available are non-simultaneous, so the results have to be handled with care. Nevertheless, in this way we can constrain the basic disk parameters, including the estimated disk mass. Assuming that the disk is populated by grains with sizes 0.1−100 μm with a collisional distribution, plus some optically thin population of small (0.1 to 2 μm) grains in the inner hole (to account for the strong silicate feature), we can obtain reasonable fits to the SED with disk masses as low as 1−3 × 10⁻³M⊙. The mass is highly dependent on the maximum grain size and on the detailed disk structure, which is beyond the scope of this paper. Our estimate of the inner hole in the disk is roughly consistent with the values of Sipos et al. 2009 (~0.4−0.5 AU, compared to their estimate of ~0.3 AU), noting that the hole radius is also highly dependent on the grain properties and structure of the inner disk rim. In particular, the hole size depends on the sizes of the small grains within the hole and whether we assume them to be distributed all over the inner disk or concentrated near the rim. Sipos et al. (2009) also demonstrated that a smoothly curved rim is necessary to reproduce the IR flux. We also find that the best fit to the quiescence SED is obtained assuming a stellar radius of 1.5 R⊙, slightly lower than the previous value of 1.6 R⊙, although this depends on the quiescence data used, given the usual low-level variability of the star during its quiescence phase. From this brief analysis, we confirm the presence of a dust hole and also suggest that the disk mass does not necessarily need to be significantly larger than typical disk masses for similar CTTS if we assume a reasonable maximum grain size.
Appendix C: Accretion rate estimates during quiescence and their effects on the radial velocities
We estimate the accretion rate of EX Lupi using the accretion-related emission lines. Our FEROS/HARPS data are not flux-calibrated, and were often taken under non-photometric conditions. Given the variability of the object, it is not even possible to estimate the line flux required to calculate accretion rates
(Alcalá et al. 2014), so we opt to use archival X-Shooter data from the ESO database. X-Shooter has three spectrograph arms (UVB, VIS, and NIR ), providing simultaneous wavelength coverage from ~300 to ~2480 nm. EX Lupi was observed as part of program 085.C-0764(A) on May 4, 2010. This epoch is intermediate (within a month) between two of our FEROS observations. The slit widths used were 0![]() 5, 0
5, 0![]() 5, and 0
5, and 0![]() 4, for exposure times of 600 s, 480 s, and 1200 s, respectively, for the UVB, VIS, and NIR arms. We used the 1-D spectra, which had been calibrated for wavelength and flux from ESO Phase 3 Data Release. With the relations between the line luminosity and accretion luminosity, we derive the accretion luminosity of EX Lupi using ten emission lines including He I 5876, 6678, 7065 Å, Hα, Ca II 8498, 8542, 8862 Å, Paβ, Paγ, and Paσ (Alcalá et al. 2014). The mass accretion rates can then be calculated from the inferred accretion luminosities using the relation
4, for exposure times of 600 s, 480 s, and 1200 s, respectively, for the UVB, VIS, and NIR arms. We used the 1-D spectra, which had been calibrated for wavelength and flux from ESO Phase 3 Data Release. With the relations between the line luminosity and accretion luminosity, we derive the accretion luminosity of EX Lupi using ten emission lines including He I 5876, 6678, 7065 Å, Hα, Ca II 8498, 8542, 8862 Å, Paβ, Paγ, and Paσ (Alcalá et al. 2014). The mass accretion rates can then be calculated from the inferred accretion luminosities using the relation  (C.1)where Rin denotes the truncation radius of the disk, which is taken to be 5 R⋆ (Gullbring et al. 1998); G is the gravitational constant; M⋆ is the stellar mass; and R⋆ is the stellar radius. The accretion rates estimated from the ten lines range from 2 × 10⁻¹⁰ to 6 × 10⁻¹⁰ M⊙ yr-1 with an average of 4 ± 2 × 10⁻¹⁰ M⊙ yr-1. In order to put these values in context with our HARPS/FEROS observations, we used the Hα line to infer whether the X-Shooter spectrum was taken at a low or a high accretion rate with respect to the typical quiescence values. The Hα 10% velocity width in the X-Shooter data is 320 km s-1. The two closest FEROS spectra (taken 10 days before and 18 days after the X-Shooter data) have Hα 10% widths of 320 and 360 km s-1, respectively. These values are between low and intermediate, compared with the rest of FEROS/HARPS data analysed, although variations in timescales of days or weeks are often seen within our collection. Comparing the strength of the Ca II BC of the lines, the X-Shooter spectrum also has an intermediate-strength BC (with a difference in resolving power), also stronger than the two closest FEROS spectra (which have negligible Ca II BC). With this information, we consider that the measured accretion rate of 4 ± 2×10⁻¹⁰ M⊙ yr-1 is probably an intermediate value within the typical variations of EX Lupi in quiescence.
|
Fig. C.1
Line fit parameters for the NC of the Ca II IR (left) and He II lines (right), colour-coded according to their accretion rate (see text). The upper panel shows the RV of the NC line (VNC), the middle panel the amplitude of the NC line (ANC), and the bottom panel the Gaussian width (σNC). There is no evident modulation of the RV with the accretion rate, and only the line width for the Ca II NC seems to be higher for the higher accretion rates, although this could be also an effect of the presence of a stronger underlying BC. The signatures observed in the NC are thus very robust with respect to variations of the accretion rate within one order of magnitude. |
|
| Open with DEXTER | |
Increases in the Hα EW and velocity wings are usually interpreted as increases in the accretion rate (Natta et al. 2004). In EX Lupi, the BC of the Ca II IR triplet becomes stronger when the accretion rate increases. For the objects with lower accretion rates, according to Hα, the BC of the Ca II IR triplet becomes undetectable. We thus can use the strength of the BC of the Ca II IR lines to classify our data according to their accretion levels, considering high accretion (BC peak ≥1 over the normalised continuum levels), intermediate accretion (BC peak 0.2−1 over the normalised continuum levels), and low accretion (BC peak <0.2 or undetectable). These values would roughly correspond to accretion rates of a few times 10-9M⊙/yr, between 5 × 10⁻¹⁰−10-9M⊙/yr, and below 5 × 10⁻¹⁰M⊙/yr. This classification allowed us to examine to what extent the NC is affected by variations in the accretion rate. Surprisingly, variations in the accretion rate within this range do not seem to affect the NC RVs nor amplitudes (Fig. C.1). Only the width of the NC of the Ca II IR triplet seems to increase in some of the higher accretion spectra, but this could also be due to contamination by the stronger BC, especially when the BC is centred around zero velocity. There is also no significant correlation between the phase and the strength of the accretion rate. For datasets taken on subsequent days, we usually observe that the accretion rate/strength of the features is relatively constant, independent of the shape of the feature.
Appendix D: Cross-correlation tables for the Ca II line fits
The following tables include the results of the cross-correlation of the three Gaussian fit for the Ca II 8498 and 8662 Å lines. For all the correlations, we perfomed a Spearman rank test providing the correlation coefficient (r) and false-alarm probability (p) for the various Gaussian parameters: amplitude (A1, A2, A3), central wavelength (C1, C2, C3), and width (S1, S2, S3). The fit of each Gaussian component is marked by a number: 1 for the NC, 2 for the weakest BC, and 3 for the strongest BC. For the autocorrelation of every line, we check the relation between all different fit parameters to explore potential common dependencies between the three components (Tables D.1 and D.2). With the two-line correlation, we explore whether the independent fit of the two Ca II 8498 and 8662 Å lines provides consistent results, as both lines of the triplet are expected to be similar (Table D.3). The most significant autocorrelations appear between the width and amplitude of the lines, suggesting that broader lines also tend to be stronger. This is consistent with an accretion scenario where an increased rate requires more material coming from more distant regions in the disk and results in the heating of a larger part of the accretion structure. The width of the NC could also be affected by increased accretion, although this could be also due to contamination by the strong BC.
Correlation coefficients for the Gaussian fits to the CaII 8498 Å lines.
Correlation coefficients for the Gaussian fits to the CaII 8662 Å lines.
Cross-correlation coefficients for the Gaussian fits to the CaII 8498 and 8662Å lines.
In the two-line cross-correlation, we observe that all the parameters are strongly correlated (as expected for two nearly identical lines), except for the centre of the second Gaussian component probably because the fitting is degenerated: the main BC component is often nicely reproduced by a single Gaussian, so the remaining Gaussian component is often weak and poorly defined. Although the three-Gaussian model offers a very good fit to the line profiles, we observe small deviations from the symmetric Gaussian profiles in the BC that suggest a more complex situation.
Appendix E: The behaviour and properties of individual lines
This appendix describes in detail the properties of the most prominent lines observed in EX Lupi.
The Ca II lines
The two Ca II IR triplet lines that are covered by FEROS (at 8498 Å and 8662 Å, the line at 8542 Å falls within the gap) behave in a very similar way and have similar profiles. They have a very stable NC and a remarkably variable BC, which appears redshifted and blueshifted up to velocities over ±200 km s-1, and with a peak located up to ±100 km s-1. The presence of a strong BC depends on the accretion rate; the BC becomes undetectable at low accretion rates. The NC is always detected and does not change much; its peak, once extracted from the BC, is always in the range of 1−1.5 over the normalised continuum. The lines do not show any significant RV modulation, although there is a clear offset between their velocity and the zero velocity of the photosphere. There is also a <1 km s-1 systematic offset between the velocity of the 8498 Å and 8662 Å, probably caused by the differences in the optical depths of the lines (see main text).
Regarding the amplitude of the BC, there is a low-significance modulation, especially at times of high accretion/strong BC (Fig. E.1). The amplitude is largest at zero velocity, which is the opposite to what we see with high-excitation lines such as He II. This is consistent with the Ca II IR lines (and, in particular, the BC) being produced in a less embedded area of the accretion column. Therefore, we get more emission when the structure is facing us (at zero velocity), while for lines that are produced more deeply in the accretion column, the strongest emission is seen when we are looking at the structure from the side.
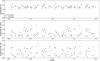 |
Fig. E.1
Phase-folded curves (using the photospheric absorption line period and phase, which is nearly identical to the He II 4686 Å period and phase) for the amplitude of the multi-Gaussian model used to fit the CaII IR lines. Top: NC. Middle: blueshifted BC. Bottom: redshifted BC. There is a marginal amplitude modulation of the BC amplitude. |
| Open with DEXTER | |
In the IR, we also find the CaII 8248 and 8927 Å . Both lines are narrow, very weak and typically noisy, so we cannot obtain much information from them. The 8927 Å line is not detectable in spectra taken at low accretion. The CaII H and K lines in the near-UV have a very different morphology compared to the IR lines. The NC+BC structure is not so evident. The BC has a very strong blueshifted absorption, which is not smooth, but also appears to have some structure. Some redshifted absorption could also be present on certain dates. The blueshifted absorption is clearly correlated with the strength of the accretion rate and likely results from an accretion-powered wind.
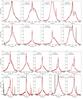 |
Fig. E.2
Some examples of day-to-day modulation of the BC of the Ca II lines (8498 Å line in red, 8662 Å line in black). For each set, phase (φ) and date (d = JD-2 455 000) are given. |
| Open with DEXTER | |
Examining the shape of the BC of the Ca II IR triplet vs. the phase, we find that they are not completely independent. The rapid day-to-day variability observed during outburst (SA12) with strong shifts of the BC peak is evident here when comparing observations taken on consecutive days (Fig. E.2). Selecting only the cases where the BC is strong (≥0.3 over the continuum level) and has a simple shape, we classified the shape of the peak as centred (if the velocity of the BC peak is in the range ±20 km s-1), redshifted (for velocities >20 km s-1), blueshifted (for velocities <−20 km s-1), and double-peak (if the BC has two peaks with normalised height differences <0.2). For each case, we measured both the 8498 Å and 8662 Å lines, and the final classification depends on the averaged result, plus a visual inspection to remove uncertain cases (e.g. those where the top of the BC is flat over a large velocity range). Most of the data points are consistent with either central or blueshifted BC, given that redshifted components tend to fail the strength criterion, often being weaker. Blueshifted BC appear at phases between 0.24−0.5, corresponding to the phases for which the emission lines move from no-shift to blueshifted (Fig. E.3). A KS test shows a probability of 0.9% that the phase correlation is random, which points to a significant correlation between the BC shape and the NC line modulation, and thus to a common dynamical origin. If we assume that the BC is formed in the same accretion structure where the NC comes from, but at a larger distance, the presence of blueshifted BC at these phases would indicate a slightly trailing column, where the material is seen as coming to the observer while the footprint of the accretion column where the NC originates moves from zero to maximum blueshifted velocity with respect to the observer.
|
Fig. E.3
Shape of the BC (classified as centred, blueshifted, redshifted, and double-peaked, see text) vs. phase. Only data points with strong BC and a clear peak are classified. |
|
| Open with DEXTER | |
The He I and He II lines
We detect several strong He I lines: at 4471, 5015, 5875, 6678, and 7065 Å. The He I lines differ from the metallic lines in that they do not have a clear NC+BC structure, although this structure was present in the outburst (SA12). They are typically broader than the NC of the metallic lines. This was also observed in outburst (SA12) and has been noted in other stars (Beristain et al. 1998), with the stronger 5875 Å line being up to ~20−30 km s-1, but not broad enough to be regarded as BC. In some cases, a weak BC (which can be blueshifted or redshifted) is also seen. The sharp cut of the 5875 and 6678 Å lines on the blue side could be a blueshifted absorption, a possible wind signature. Unlike the Ca II lines, the He I lines can sometimes become very weak when the accretion rate drops.
The He I lines show the same kind of modulation as is observed in the metallic lines. The amplitude of the modulation is of the same order as the RV amplitude for the photospheric absorption lines, although there is a clear offset between the zero velocities of both. This is a similar effect to what Gahm et al. (2013) observed for the He I lines of RU Lupi. We also observe a mild modulation of the amplitude, similar to what is observed for other metallic lines (Mg I, Fe I, Fe II), but with more noise, perhaps because the line fits are not so well defined owing to the presence of blueshifted absorption components. The potential blueshifted absorption component, which could correspond to a wind, does not show any clear RV variation.
The He II line at 4686 Å is remarkably strong for a low-mass star. Like the He I lines, it has only one component that is broader than the usual metallic NC. The line sometimes appears to have a redshifted tail (perhaps due to an infalling, turbulent component), although it could also be caused by a nearby line (there are many weak and strong lines in the blue and UV part of the spectrum). He II shows the most remarkable and tight RV modulation pattern of all the lines, considering that the line is relatively weak and that it is located in a rather noisy part of the spectrum. Its periodogram shows a very sharp peak at 7.41d, the same as the period observed for the photospheric absorption lines. There is no clear modulation of the line amplitude, although an increase in the blue continuum during episodes of stronger accretion may mask accretion-related flux variations.
The Fe I and Fe II lines
The Fe II lines are among the strongest lines after the typical H, He, and Ca II lines. In particular, multiplet 42 is strong in emission, with good S/N lines at 4923 and 5018 Å . The lines show the NC+BC structure, although in this case the BC is much weaker than for Ca II. The BC shows the same kind of modulation as observed for Ca II. The NC reveals a clear RV modulation with an amplitude comparable to that of the photospheric absorption line, but clearly off-phase. There is also a small modulation of the amplitude, of the same type as described for He II (smaller amplitude at zero velocity) and thus opposite to the amplitude variations of the Ca II IR BC.
The same result is found in other Fe II and Fe I transitions. Other strong iron lines include Fe II at 5362, 5316 Å (this one is very strong and may sometimes have a weak blueshifted absorption), 4549, 4383, 4385 Å and Fe I lines at 5269, 5270 Å. Fe I 5371.49 Å has a nearby unidentified line at about 5369.95 Å, both of which are weak. The Fe I lines in the 3700−4000 Å region are usually noisy and weak. In general, the behaviour of the Fe II and Fe I lines is similar. Their BC show bulk velocity shifts that are consistent with those of Ca II. Their NC have clear RV modulations, although some of the lines are too weak or too noisy to find a clear pattern in them. Different lines have different zero-point RV and amplitudes.
The Mg I multiplet at 5167, 5172, 5183 Å
Several Mg I lines are also detected in the quiescence spectra, among them the multiplet at 5167, 5172, and 5183 Å. The lines are strong and mostly narrow, with BC that are usually faint and noisy but become stronger when the BC of Ca II IR gets stronger. They show similar velocity patterns to the Ca II and Fe I, Fe II lines. The NC shows the usual RV modulation observed in Fe I and Fe II, opposite to the photospheric lines RV, and the same variations in amplitude vs. phase, with the lines getting stronger at the maximum blueshifted and redshifted velocity. As also occurs for the Ca II lines, there is a small offset in velocity between the 5167 Å line and the other two, although in this case contamination by a nearby strong Fe I line cannot be excluded.
The O I 7774 triplet and 8446 Å line
The O I triplet around 7774 Å and 8446 Å are also very strong in EX Lupi. The 8446 Å complex, being a blended triplet itself, has a complex structure, very extended and rather weak or undetectable at low accretion rates. It does not have a clear NC, although it is narrower in the centre and has very extended BC wings (up to ±150 km s-1) that changes from blueshifted to redshifted following the patterns observed for Ca II. The line could sometimes have a weak redshifted absorption, although owing to the low S/N and the redshifted emission of the BC, it is not evident. Because of the complexity of the line, it is not possible to study its RV.
The OI 7774 triplet is much stronger and is always detected. The 7772 Å line is very strong and narrow and easy to fit, giving very good results. Having a typical width around 14−16 km s-1, it also shows a BC when the accretion rate increases. The behaviour of the BC is hard to establish because of the presence of the other triplet lines. Fitting the two weaker lines is often a problem owing to the contamination by the BC of the strong 7772 Å line. The 7772 Å line displays the same kind of RV modulation as the rest of metallic lines, and has the same weak modulation of the line amplitude. Its width could also be modulated, becoming thinner when the amplitude decreases, but this is very uncertain owing to the complexity of the continuum around the triplet where the BC of all three lines are blended.
Other lines
As mentioned in SA12, EX Lupi in quiescence shows more than 200 emission lines, of which at present we have only investigated the strongest ones. Other lines include neutral elements (such as Mn I and Cr I), which are weaker than the mentioned Fe I and Mg I lines, and other ionised species (mostly Si II and Ti II). Table A.3 contains the list of strong, unblended lines identified in the spectra.
The Cr I 4254 and 4274 Å lines are relatively strong and narrow (~8−10 km s-1), although they are partially affected by photospheric absorption lines. Although they are noisier, they show the same RV and amplitude modulation as the other metallic lines.
The Si II 6347 and 6371 Å lines are also relatively strong. The 6347 Å line sometimes shows evidence for a BC with the usual velocity pattern, although the lines become nearly undetectable when the accretion rate decreases. Both lines show the RV modulation observed for the rest of metallic lines, although the amplitude of the modulation is slightly lower than observed for the photospheric absorption lines.
The Ti II lines at 4300, 4302, and 4307 Å are also detected, despite the poor S/N of the spectra in this area. They are narrow (8−12 km s-1), although one of the spectra shows a hint of a BC. Despite the high noise level, they show the usual RV modulation with a peak-to-peak amplitude of about 6 km s-1 and the usual sinusoidal modulation, although in blue and UV lines the amplitude can easily be distorted by poor continuum determination when the S/N is low.
Other lines such as Mn I at 4030 Å are very faint, so any attempt to fit and extract them is noise-dominated.
© ESO, 2015
Current usage metrics show cumulative count of Article Views (full-text article views including HTML views, PDF and ePub downloads, according to the available data) and Abstracts Views on Vision4Press platform.
Data correspond to usage on the plateform after 2015. The current usage metrics is available 48-96 hours after online publication and is updated daily on week days.
Initial download of the metrics may take a while.