Fig. C.1
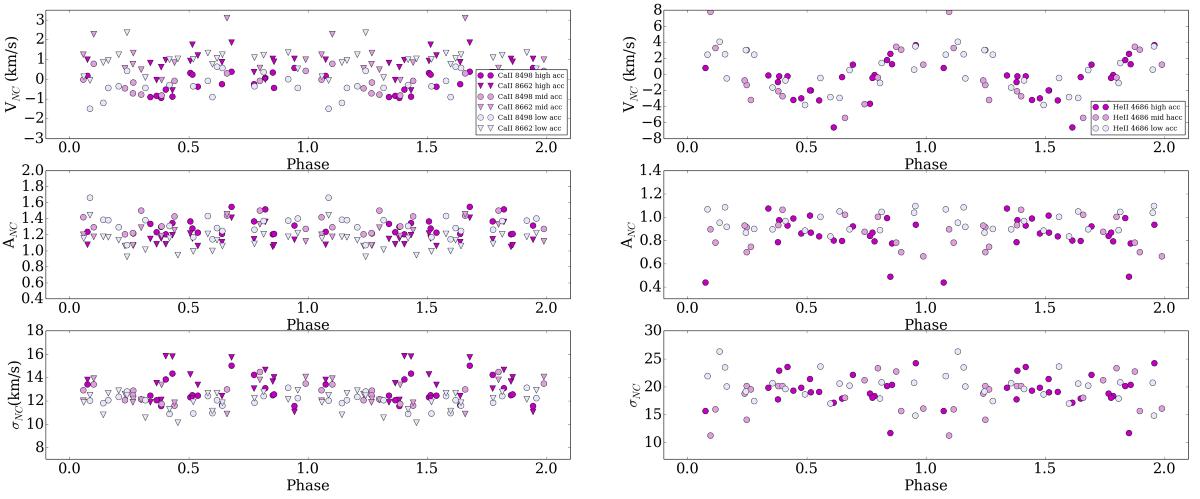
Line fit parameters for the NC of the Ca II IR (left) and He II lines (right), colour-coded according to their accretion rate (see text). The upper panel shows the RV of the NC line (VNC), the middle panel the amplitude of the NC line (ANC), and the bottom panel the Gaussian width (σNC). There is no evident modulation of the RV with the accretion rate, and only the line width for the Ca II NC seems to be higher for the higher accretion rates, although this could be also an effect of the presence of a stronger underlying BC. The signatures observed in the NC are thus very robust with respect to variations of the accretion rate within one order of magnitude.
Current usage metrics show cumulative count of Article Views (full-text article views including HTML views, PDF and ePub downloads, according to the available data) and Abstracts Views on Vision4Press platform.
Data correspond to usage on the plateform after 2015. The current usage metrics is available 48-96 hours after online publication and is updated daily on week days.
Initial download of the metrics may take a while.