| Issue |
A&A
Volume 579, July 2015
|
|
|---|---|---|
| Article Number | A71 | |
| Number of page(s) | 46 | |
| Section | Interstellar and circumstellar matter | |
| DOI | https://doi.org/10.1051/0004-6361/201525953 | |
| Published online | 30 June 2015 | |
Online material
Appendix A
Flux densities of the Hii regions classified as “ultracompact” and “compact” in the CORNISH catalogue.
Distances, Lyman continuum photon rates, bolometric luminosities, and clump masses of the 200 Hii regions of our sample for which a distance estimate was possible.
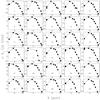 |
Fig. A.1
Spectral energy distributions of the CORNISH Hii regions with Hi-GAL counterparts of at least three bands. In addition to Hi-GAL, the MSX 21 μm, WISE 22 μm, ATLASGAL 870 μm, and BGPS 1.1 mm flux densities have also been used. The number in each box identifies the source according to the numbering in Table A.1. |
| Open with DEXTER | |
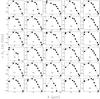 |
Fig. A.1
continued. |
| Open with DEXTER | |
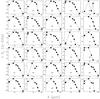 |
Fig. A.1
continued. |
| Open with DEXTER | |
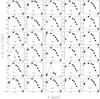 |
Fig. A.1
continued. |
| Open with DEXTER | |
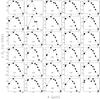 |
Fig. A.1
continued. |
| Open with DEXTER | |
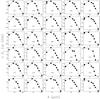 |
Fig. A.1
continued. |
| Open with DEXTER | |
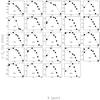 |
Fig. A.1
continued. |
| Open with DEXTER | |
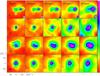 |
Fig. A.2
Hi-GAL images of the sources lying above the blackbody curve in Fig. 5. The sources are identified by the numbers in Col. 1 of Table A.1. The black circles represent the CORNISH Hii regions in the field of view, with diameter equal to the angular size given in Col. 8 of Table 3 in Purcell et al. (2013). The HPBW at each wavelength is shown in the bottom right of the top panels. |
| Open with DEXTER | |
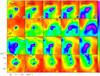 |
Fig. A.2
continued. |
| Open with DEXTER | |
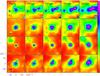 |
Fig. A.2
continued. |
| Open with DEXTER | |
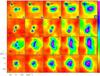 |
Fig. A.2
continued. |
| Open with DEXTER | |
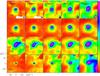 |
Fig. A.2
continued. |
| Open with DEXTER | |
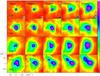 |
Fig. A.2
continued. |
| Open with DEXTER | |
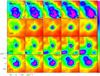 |
Fig. A.2
continued. |
| Open with DEXTER | |
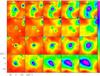 |
Fig. A.3
Same as Fig. A.2 for the sources lying between the blackbody curve (dashed line) and the single ZAMS star curve (solid line) in Fig. 5. |
| Open with DEXTER | |
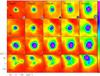 |
Fig. A.3
continued. |
| Open with DEXTER | |
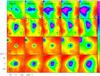 |
Fig. A.3
continued. |
| Open with DEXTER | |
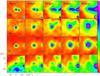 |
Fig. A.3
continued. |
| Open with DEXTER | |
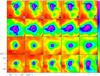 |
Fig. A.3
continued. |
| Open with DEXTER | |
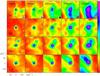 |
Fig. A.3
continued. |
| Open with DEXTER | |
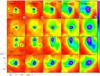 |
Fig. A.3
continued. |
| Open with DEXTER | |
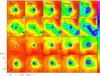 |
Fig. A.3
continued. |
| Open with DEXTER | |
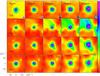 |
Fig. A.3
continued. |
| Open with DEXTER | |
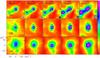 |
Fig. A.3
continued. |
| Open with DEXTER | |
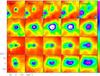 |
Fig. A.4
Same as Fig. A.2 for the sources lying inside the cluster region (hatched area) in Fig. 5. |
| Open with DEXTER | |
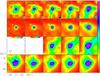 |
Fig. A.4
continued. |
| Open with DEXTER | |
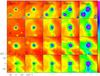 |
Fig. A.4
continued. |
| Open with DEXTER | |
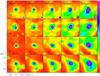 |
Fig. A.4
continued. |
| Open with DEXTER | |
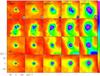 |
Fig. A.4
continued. |
| Open with DEXTER | |
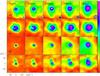 |
Fig. A.4
continued. |
| Open with DEXTER | |
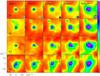 |
Fig. A.4
continued. |
| Open with DEXTER | |
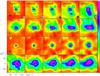 |
Fig. A.4
continued. |
| Open with DEXTER | |
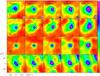 |
Fig. A.4
continued. |
| Open with DEXTER | |
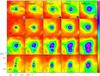 |
Fig. A.4
continued. |
| Open with DEXTER | |
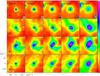 |
Fig. A.4
continued. |
| Open with DEXTER | |
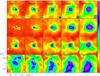 |
Fig. A.4
continued. |
| Open with DEXTER | |
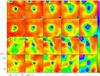 |
Fig. A.4
continued. |
| Open with DEXTER | |
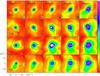 |
Fig. A.4
continued. |
| Open with DEXTER | |
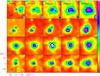 |
Fig. A.4
continued. |
| Open with DEXTER | |
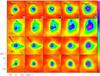 |
Fig. A.4
continued. |
| Open with DEXTER | |
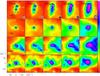 |
Fig. A.4
continued. |
| Open with DEXTER | |
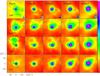 |
Fig. A.4
continued. |
| Open with DEXTER | |
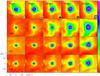 |
Fig. A.4
continued. |
| Open with DEXTER | |
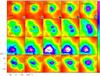 |
Fig. A.4
continued. |
| Open with DEXTER | |
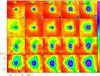 |
Fig. A.4
continued. |
| Open with DEXTER | |
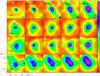 |
Fig. A.4
continued. |
| Open with DEXTER | |
|
Fig. A.4
continued. |
|
| Open with DEXTER | |
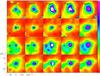 |
Fig. A.5
Same as Fig. A.2 for the sources lying below the cluster region in Fig. 5. |
| Open with DEXTER | |
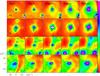 |
Fig. A.5
continued. |
| Open with DEXTER | |
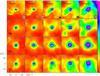 |
Fig. A.5
continued. |
| Open with DEXTER | |
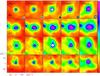 |
Fig. A.5
continued. |
| Open with DEXTER | |
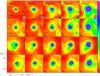 |
Fig. A.5
continued. |
| Open with DEXTER | |
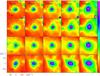 |
Fig. A.5
continued. |
| Open with DEXTER | |
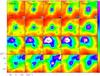 |
Fig. A.5
continued. |
| Open with DEXTER | |
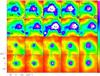 |
Fig. A.5
continued. |
| Open with DEXTER | |
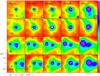 |
Fig. A.5
continued. |
| Open with DEXTER | |
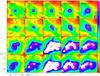 |
Fig. A.5
continued. |
| Open with DEXTER | |
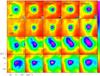 |
Fig. A.5
continued. |
| Open with DEXTER | |
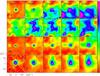 |
Fig. A.6
Same as Fig. A.2 for the sources without distance estimates. |
| Open with DEXTER | |
© ESO, 2015
Current usage metrics show cumulative count of Article Views (full-text article views including HTML views, PDF and ePub downloads, according to the available data) and Abstracts Views on Vision4Press platform.
Data correspond to usage on the plateform after 2015. The current usage metrics is available 48-96 hours after online publication and is updated daily on week days.
Initial download of the metrics may take a while.