Fig. A.2
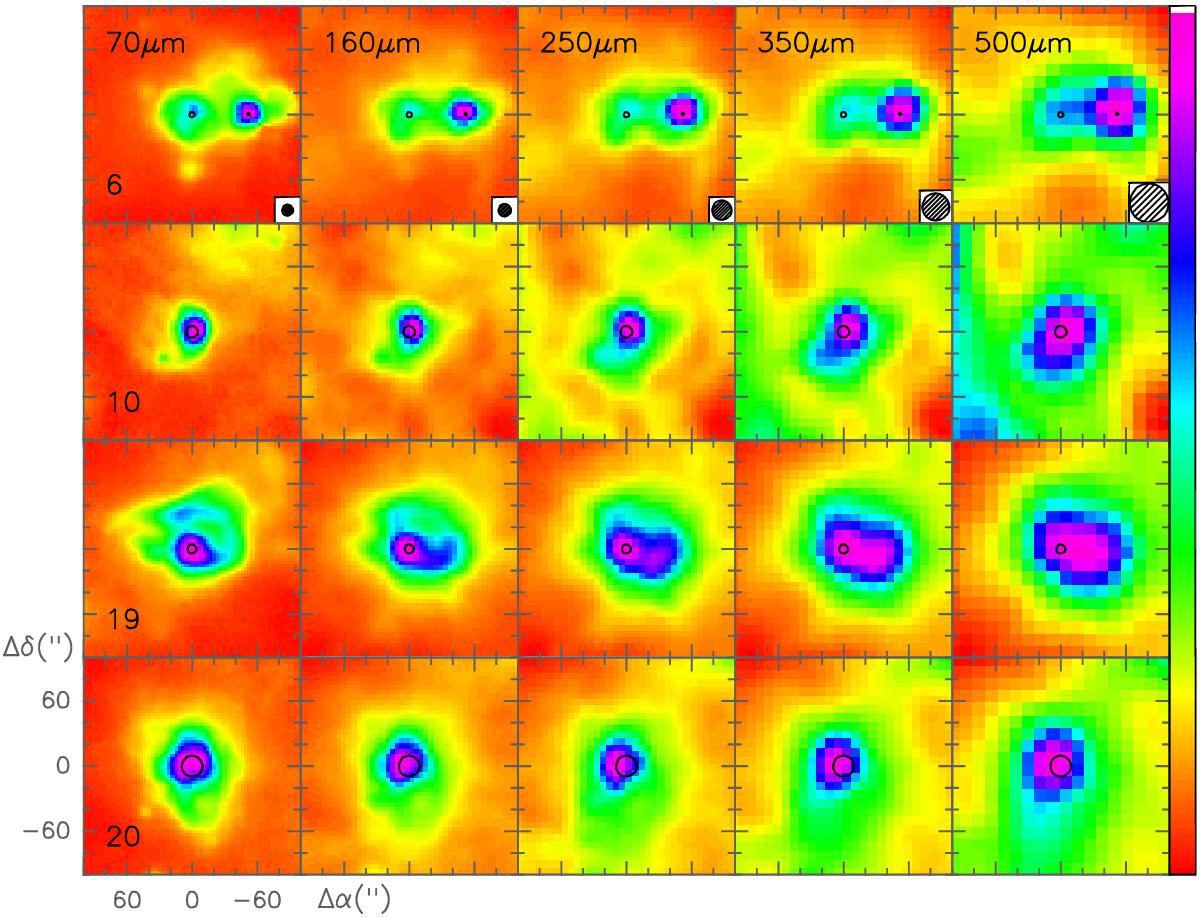
Hi-GAL images of the sources lying above the blackbody curve in Fig. 5. The sources are identified by the numbers in Col. 1 of Table A.1. The black circles represent the CORNISH Hii regions in the field of view, with diameter equal to the angular size given in Col. 8 of Table 3 in Purcell et al. (2013). The HPBW at each wavelength is shown in the bottom right of the top panels.
Current usage metrics show cumulative count of Article Views (full-text article views including HTML views, PDF and ePub downloads, according to the available data) and Abstracts Views on Vision4Press platform.
Data correspond to usage on the plateform after 2015. The current usage metrics is available 48-96 hours after online publication and is updated daily on week days.
Initial download of the metrics may take a while.