| Issue |
A&A
Volume 579, July 2015
|
|
|---|---|---|
| Article Number | A102 | |
| Number of page(s) | 28 | |
| Section | Extragalactic astronomy | |
| DOI | https://doi.org/10.1051/0004-6361/201525712 | |
| Published online | 07 July 2015 | |
Online material
Appendix A: GANDALF spectroscopy
The comparison of the Hα luminosity, corrected for dust attenuation using the Balmer decrement measured in Boselli et al. (2013), and the Hα luminosity, corrected using the 24 μm emission or the 20 cm radio continuum luminosity (Fig. A.1), shows a systematic shift of ~0.5 dex in the relations between galaxies with strong (HβEW > 5 Å) and weak (HβEW < 5 Å) Hβ emission. Given that the three variables are roughly equivalent, the observed shift probably results from a systematic bias in the spectroscopic data used to correct L(Hα)BD.
We recall that in Boselli et al. (2013), the intensity of the Hβ line has been measured by fitting the spectra with a double Gaussian, one for the emission line and the other for the underlying stellar absorption. The observed shift can thus be explained if the Balmer decrement is overestimated or the Hβ emission is underestimated by ~60%. To test whether the observed shift in the relations shown in Fig. A.1 results from a systematic bias introduced by the extraction procedure adopted in Boselli et al. (2013), we extracted the emission line fluxes of all the HRS galaxies with available spectra (Gavazzi et al. 2004; Boselli et al. 2013; 264/323 objects) using the gandalf fitting code (Sarzi et al. 2006; Falcón-Barroso et al. 2006).
gandalf is a simultaneous emission and absorption-line fitting algorithm designed to separate the relative contribution of the stellar continuum and of nebular emission in the spectra of galaxies. This code implements the pPXF method (Cappellari & Emsellem 2004), which combines and adjusts the observed spectra of several stars of all spectral type to the stellar continuum to first quantify and then remove the underlying absorption contaminating the emission of the most important emission lines, including Hβ and Hα. With this procedure, the code is expected to correctly account for the underlying stellar absorption that contaminates several emission lines, in particular the Balmer lines, which are crucial for determining the dust attenuation of the Hα line. Figures 4 and 5 show the same relationships amongst L(Hα)24 μm, L(20 cm), and L(Hα)BD as those plotted in Fig. A.1, but using gandalf data for the Balmer decrement and [NII] contamination corrections. Most of the systematic differences observed between galaxies with high and low HβEW or high and low signal-to-noise are removed using this new set of data. In the analysis presented in this work, we thus use the spectroscopic dataset extracted using gandalf. The fluxes of the different emission lines are given in Table 6, arranged as follows:
-
Column 1: Herschel Reference Sample (HRS) name.
-
Columns 2–8: observed line intensities normalised to Hα. The gandalf fitting code assumes that [OIII]λ4958 = 0.3×[OIII]λ5007 and that [NII]λ6548 = 0.3×[NII]λ6584.
-
Columns 9, 10: signal-to-noise S/N measured empirically from the spectrum as the amplitude of the Hα and Hβ lines divided by the noise in the nearby continuum.
-
Column 11: Balmer decrement C(Hβ). The contribution of the Milky Way is subtracted using the Galactic extinction map of Schlegel et al. (1998) combined with the Fitzpatrick & Massa (2007) Galactic extinction law.
-
Column 12: uncertainty on the Balmer decrement σ [C(Hβ)] obtained from standard error propagation of the uncertainties on the line fluxes.
The uncertainty on the Balmer decrement σ [C(Hβ)] is tightly correlated to the signal-to-noise measured at the Hα and Hβ lines, as depicted in Fig. A.2. For the typical spectral resolution of R ~ 1000 of the spectroscopic data used in this work (Boselli et al. 2013), the required limiting uncertainty of σ [C(Hβ)] = 0.1 is reached for a signal-to-noise of ≃50 for Hα and ≃15 for Hβ. A spectral resolution of R ≳ 1000 is required for an accurate deblending of the Hα line from the nearby [NII] lines and for an accurate determination of the underlying Balmer absorption.
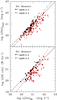 |
Fig. A.1
Relationship between the Hα luminosity corrected for dust attenuation using the 24 μm emission (upper panel), the 20 cm radio continuum luminosity (lower panel), and the Hα luminosity corrected for Balmer decrement using the spectroscopic set of data published in Boselli et al. (2013), where the line emission is directly measured on the data. Filled dots are for HI-normal (HI - def ≤ 0.4) galaxies and empty symbols for HI-deficient (HI - def > 0.4) objects. Black symbols indicate galaxies with an HβEW> 5 Å, red symbols those with HβEW< 5 Å. The black solid line shows the 1:1 relation, the black long dashed line the bisector fit to the high-quality data (black symbols), and the red dotted line the best fit to the whole dataset. |
| Open with DEXTER | |
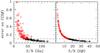 |
Fig. A.2
Relationship between the uncertainty on the Balmer decrement σ [C(Hβ) and the Hα and Hβ signal-to-noise. The horizontal dashed line shows the σ [C(Hβ)] = 0.1 limit adopted in this work to identify good quality objects (black symobls) from uncertain measurements (red symbols). |
| Open with DEXTER | |
Appendix B: Radio continuum data
We have collected radio continuum data at 1.49 GHz (20 cm) obtained at the VLA for 191 HRS galaxies. These data were taken, in order of preference, from the pointed survey of IRAS bright galaxies of Condon et al. (1990), from the survey of optically selected galaxies of Condon (1987), or from the survey of galaxies with the H-band magnitudes of Condon et al. (1987). The data presented in these papers were obtained under similar VLA configurations (generally D and C/D) and thus have a comparable angular resolution (~45 arcsec). The typical rms noise level of these observations is 0.1–0.2 mJy per beam. Flux densities of the remaining galaxies were taken from the NVSS survey of Condon et al. (1998) and published in Condon et al. (2002) whenever available, or extracted by us from the NVSS survey catalogue assuming a search radius of 15 arcsec. These data were homogeneously taken in VLA-D configuration and have a typical resolution of 45 arcsec and a sensitivity of 0.45 mJy rms. For three galaxies, we adopted the integrated flux densities obtained by the FIRST survey (Becker et al. 1995). The FIRST survey was completed using the VLA in B configuration and thus has an angular resolution of ≲5 arcsec. Because of the adopted configuration, this survey is sensitive to compact sources and might miss some of the low surface brightness extended emission. Its typical sensitivity is 0.15 mJy rms.
Table 7 gives the radio data for all the HRS galaxies. Table 7 is arranged as follows:
-
Column 1: Herschel Reference Sample (HRS) name.
-
Column 2: sign indicating detections (1) and non-detections (0).
-
Column 3: flux density S(20 cm) or upper limit in mJy. For the undetected objects, we estimate an upper limit to the flux density Sul(20 cm) = 4 × rms and assume the same typical rms noise of the NVSS survey of 0.45 mJy for all galaxies.
-
Column 4: logarithm of the 20 cm radio luminosity or upper limit in W Hz-1.
-
Column 5: flag to the data, as indicated in the original papers, where 1 stands for galaxies with good quality observations, 2 for uncertain values.
-
Column 6: references to the data: 1: Condon et al. (1990); 2: Condon (1987); 3: Condon et al. (1987); 4: Condon et al. (2002); 5: extracted as described in the text from the NVSS survey (Condon et al. 1998); 6: extracted from the FIRST survey (Becker et al. 1995).
Appendix C: Adopted calibrations of the different star formation tracers
The Hα and FUV star formation rates used in this work were determined using the relation, ![]() (C.1)where the different values of Kλ used in this work are given in Table C.1 (adapted from Hao et al. 2011).
(C.1)where the different values of Kλ used in this work are given in Table C.1 (adapted from Hao et al. 2011).
Calibrations of the different star formation tracers.
The attenuation corrected Hα luminosity have been determined using either the Balmer decrement or the following relation (from Calzetti et al. 2010): 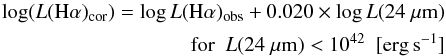 (C.2)and
  (C.3)where the observed (L(Hα)obs)12 and corrected (L(Hα)cor) Hα luminosities and the 24 μm luminosity (L(24 μm)) are expressed in erg s-1.
The corrected UV luminosities are determined using the recipes of Hao et al. (2011): ![]() (C.4)Star formation rates from radio continuum luminosities at 1.49 GHz (20 cm) have been determined using the calibration of Bell (2003):
(C.4)Star formation rates from radio continuum luminosities at 1.49 GHz (20 cm) have been determined using the calibration of Bell (2003): ![]() (C.5)
(C.5) (C.6)where the radio luminosity is expressed in W Hz-1, and Lc = 6.4 × 10²¹ W Hz-1.
The different estimates of the star formation rate are listed in Table 10, arranged as follows:
-
Column 1: Herschel Reference Sample (HRS) name.
-
Column 2: SFRHα + BD determined by correcting the Hα luminosity using the Balmer decrement derived using the gandalf code for galaxies with SN> 50.
-
Column 3: SFRHα + 24 μm determined by correcting the Hα luminosity using the 24 μm emission and Eqs. (C.2) and (C.3).
-
Column 4: SFRFUV + 24 μm determined by correcting the FUV luminosity using the 24 μm emission and Eq. (C4).
-
Column 5: SFRradio determined using the relation C.5 and C.6. This value has been determined only in galaxies with high-quality radio data (flag = 1 in Table 7).
-
Column 6: SFRMED, mean value of the different monochromatic estimates given in Cols. 2–5.
-
Column 7: SFR1exp derived by fitting the SED with the CIGALE code using one exponentially declining star formation history.
-
Column 8: SFR2exp derived by fitting the SED with the CIGALE code using two exponentially declining star formation histories.
-
Column 9: SFRdel derived by fitting the SED with the CIGALE code using a delayed exponentially declining star formation history.
The star formation rates determined using the CIGALE fitting code have been measured only whenever FUV data are available. All galaxies are assumed coeval, with an age of 13 Gyr. We recall that these SFR have been measured assuming consistently a Salpeter IMF in the stellar mass range 0.1 <mstar< 100 M⊙. These values of SFR can be converted into SFR measured using a Chabrier (2003) or Kroupa (2001) IMF by dividing them by a factor of ~1.58. This value changes slightly with the assumed population synthesis model and might vary from reference to reference (Brinchmann et al. 2004; Salim et al. 2007; Bigiel et al. 2008; Argence & Lamareille 2009; Schiminovich et al. 2010; Peng et al. 2010; Chomiuk & Povich 2011).
© ESO, 2015
Current usage metrics show cumulative count of Article Views (full-text article views including HTML views, PDF and ePub downloads, according to the available data) and Abstracts Views on Vision4Press platform.
Data correspond to usage on the plateform after 2015. The current usage metrics is available 48-96 hours after online publication and is updated daily on week days.
Initial download of the metrics may take a while.