| Issue |
A&A
Volume 579, July 2015
|
|
|---|---|---|
| Article Number | A47 | |
| Number of page(s) | 18 | |
| Section | Stellar atmospheres | |
| DOI | https://doi.org/10.1051/0004-6361/201425541 | |
| Published online | 25 June 2015 | |
Online material
Appendix A: Appendix A
Appendix A.1: A.1. An alternative approach to determining Vt
In this Appendix we show the standard deviation around the mean abundance plotted as a function of the microturbulent velocity, following the approach of Sahin et al. (2011). The
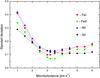 |
Fig. A.1
Standard deviation around the mean abundances as a function of microturbulence Vt for HQ Car, shown for several elements. |
| Open with DEXTER | |
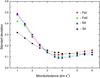 |
Fig. A.2
Same as Fig. A.1, but for DD Vel. |
| Open with DEXTER | |
dispersion of the abundances is computed for the Fe I, Fe II, Si I, and Ni I lines, while the microturbulent velocity Vt is varied from 1 to 6 km s-1. The minimum value of the dispersion is in good agreement within the different elements, confirming the values of the microturbulence (derived solely from Fe I) adopted in this study, namely 3.1 km s-1 for HQ Car and 3.8 km s-1 for DD Vel.
Appendix A.2: A.2. List of lines used
Atomic parameters and EWs of HQ Car and DD Vel.
Appendix B: Appendix B: Solar references
Solar abundance derived from the solar spectrum using the grid of models by Castelli & Kurucz (2004), compared to the solar photospheric abundance by Asplund et al. (2009) and by Reddy et al. (2003).
© ESO, 2015
Current usage metrics show cumulative count of Article Views (full-text article views including HTML views, PDF and ePub downloads, according to the available data) and Abstracts Views on Vision4Press platform.
Data correspond to usage on the plateform after 2015. The current usage metrics is available 48-96 hours after online publication and is updated daily on week days.
Initial download of the metrics may take a while.