| Issue |
A&A
Volume 577, May 2015
|
|
|---|---|---|
| Article Number | A79 | |
| Number of page(s) | 11 | |
| Section | Interstellar and circumstellar matter | |
| DOI | https://doi.org/10.1051/0004-6361/201425493 | |
| Published online | 06 May 2015 | |
Online material
Appendix A: Structures of acridine and phenanthridine
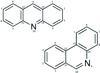 |
Fig. A.1
Numbering of atoms in acridine and phenanthridine used in this work (note that in these molecules, positions 9 and 10 are equivalent). |
| Open with DEXTER | |
AcridineH+ optimised geometry for the ground (S0) and first excited (S1) states, given in Cartesian coordinates.
PhenanthridineH+ optimised geometry for the ground (S0) and first excited (S1) states, given in Cartesian coordinates.
Appendix B: Mass spectra
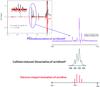 |
Fig. B.1
AcridineH+ photofragmentation mass spectrum and comparison with collision induced fragmentation and electron impact spectrum of neutral acridine. The first panel shows the experimental mass spectra: the mass spectrum without fragmentation laser is shown in red (and is multiplied by –1 to facilitate comparison), and the mass spectrum recorded with the fragmentation laser on is shown in black. The black spectrum includes the newly formed fragments around m/z 152 (major fragment) and around m/z 127 (minor fragments). The violet curve presents a zoom of the region around m/z 152, presented as a difference spectrum of the recorded spectra with laser on – laser off. This photofragmentation spectrum is different from the mass spectrum obtained by collision induced dissociation of AcH+ (plotted in black), in which the fragments m/z 150 and 151 have much higher intensity. It also differs from the mass spectrum obtained by electron impact ionisation of neutral acridine (plotted in red) which peaks at m/z 151. |
| Open with DEXTER | |
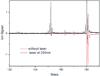 |
Fig. B.2
PhenanthridineH+ photofragmentation mass spectrum: the red trace corresponds to the mass spectrum recorded without the fragmentation laser, the black trace is the mass spectrum recorded with the fragmentation laser on and shows the appearance of fragments around m/z 152 (major fragments) and around m/z 127 (minor fragments). One spectrum is positive and the other negative just to present clearly the difference between the two spectra. |
| Open with DEXTER | |
Appendix C: PhenanthridineH+ vibronic bands
PhenanthridineH+ vibronic bands: only the bands with large intensities are tabulated. Above 26 500 cm-1, the assignments are only tentative.
© ESO, 2015
Current usage metrics show cumulative count of Article Views (full-text article views including HTML views, PDF and ePub downloads, according to the available data) and Abstracts Views on Vision4Press platform.
Data correspond to usage on the plateform after 2015. The current usage metrics is available 48-96 hours after online publication and is updated daily on week days.
Initial download of the metrics may take a while.