Fig. B.1
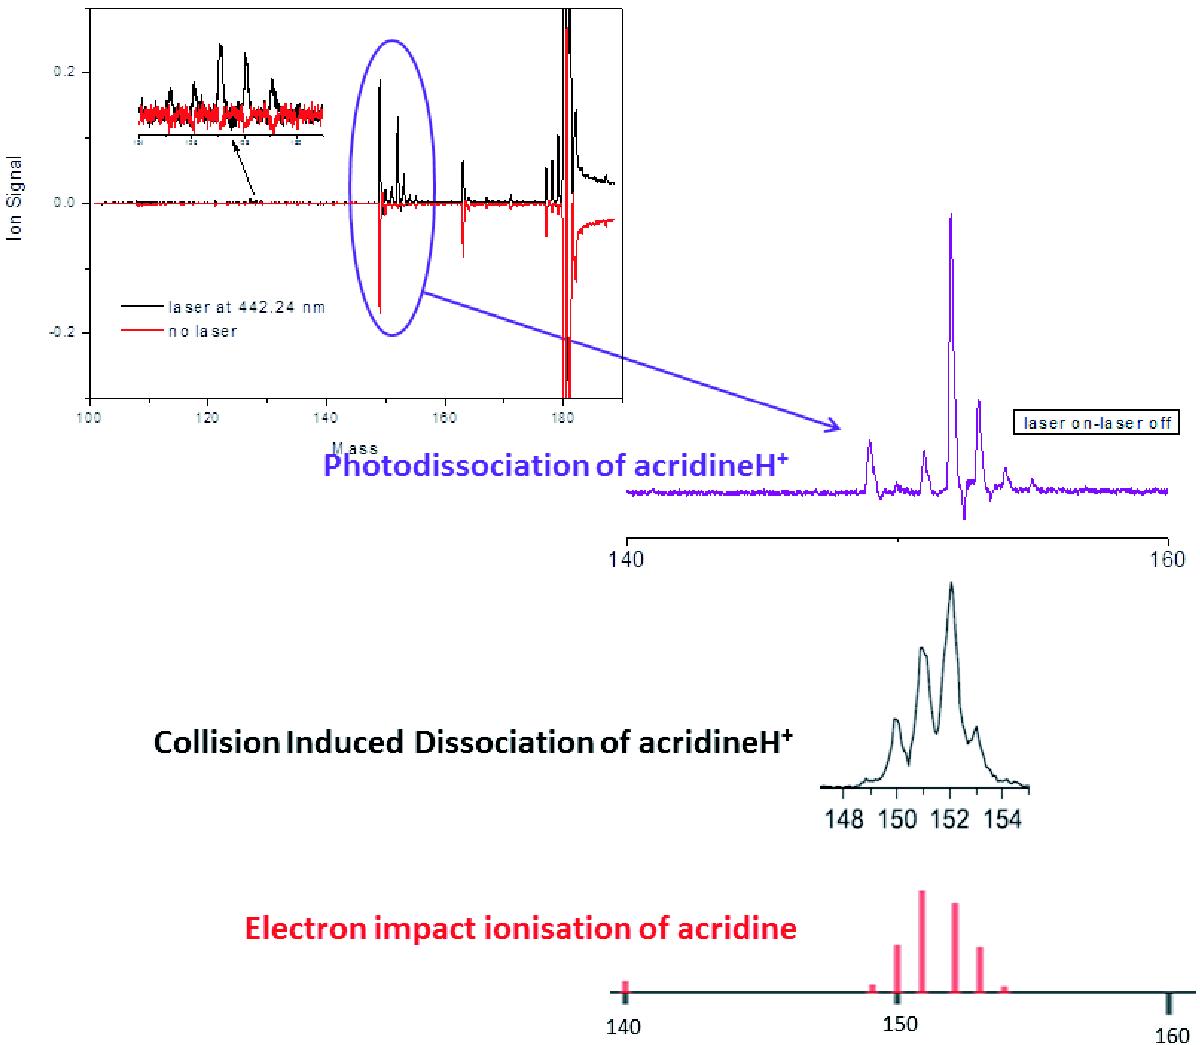
AcridineH+ photofragmentation mass spectrum and comparison with collision induced fragmentation and electron impact spectrum of neutral acridine. The first panel shows the experimental mass spectra: the mass spectrum without fragmentation laser is shown in red (and is multiplied by –1 to facilitate comparison), and the mass spectrum recorded with the fragmentation laser on is shown in black. The black spectrum includes the newly formed fragments around m/z 152 (major fragment) and around m/z 127 (minor fragments). The violet curve presents a zoom of the region around m/z 152, presented as a difference spectrum of the recorded spectra with laser on – laser off. This photofragmentation spectrum is different from the mass spectrum obtained by collision induced dissociation of AcH+ (plotted in black), in which the fragments m/z 150 and 151 have much higher intensity. It also differs from the mass spectrum obtained by electron impact ionisation of neutral acridine (plotted in red) which peaks at m/z 151.
Current usage metrics show cumulative count of Article Views (full-text article views including HTML views, PDF and ePub downloads, according to the available data) and Abstracts Views on Vision4Press platform.
Data correspond to usage on the plateform after 2015. The current usage metrics is available 48-96 hours after online publication and is updated daily on week days.
Initial download of the metrics may take a while.