| Issue |
A&A
Volume 576, April 2015
|
|
|---|---|---|
| Article Number | A83 | |
| Number of page(s) | 16 | |
| Section | Extragalactic astronomy | |
| DOI | https://doi.org/10.1051/0004-6361/201425389 | |
| Published online | 02 April 2015 | |
Online material
Appendix A: Chemical abundances
Figure A.1 shows the abundance ratios N/O, Ne/O, S/O, Ar/O, Cl/O, Fe/O as a function of O/H for both our DR10 and DR7 samples (red and blue points, respectively). Note that we measured the S abundance only for objects from our DR10 sample since in the DR7 sample, the [S iii] λ9069 line for all the objects with measured [O ii] λ3727 lies beyond the spectroscopic range. The slight observed tendency between S/O and O/H might be due to inaccurate ionization correction factors. An improvement of the ionization correction factors presented in Izotov et al. (2006) would require a dedicated study that is beyond the scope of the present paper. The large dispersion in the computed Cl/O abundance ratios is essentially due to the extreme weakness of the lines and the large associated error bars. The dispersion in the N/O ratios is real and discussed in detail in Vale Asari et al. (in prep.). The trend of Fe/O decreasing with increasing O/H, already noted by Izotov et al. (2006) using galaxies from SDSS DR3, is an indication that more Fe is depleted into dust grains as metallicity increases.
For the photoionization modeling described in Sect. 4 we took a chemical composition defined by the mean abundances of our DR7-DR10 sample.
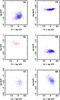 |
Fig. A.1
Abundance ratios in our galaxy sample. DR10 objects are plotted in red, DR7 objects are in blue. The total number of objects included in each panel is indicated in the upper right corner. |
| Open with DEXTER | |
Appendix B: Didactic diagrams
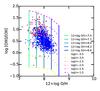 |
Fig. B.1
Effect of metallicity on the [O iii]/[O ii] ratio obtained from photoionization models. The models are computed for a PopStar ionizing radiation field (age 1 Myr) and are ionization-bounded. Continuous lines join models of same metallicity, while dashed lines join models with same ionization parameter. The color code is given in the plot. The positions of the observational points for our samples (red for DR10, blue for DR7) are shown for comparison. |
| Open with DEXTER | |
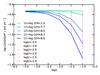 |
Fig. B.2
Values of L(Hβ) /Q(H0) as a function of |
| Open with DEXTER | |
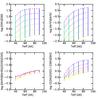 |
Fig. B.3
Variations of several line ratios with blackbody temperature for different values of the ionization parameter (ionization-bounded models with 12 + log O/H = 8). Continuous lines join models of same effective temperature, while dashed lines join models with same ionization parameter. The color coding is the same as in Fig. 11. |
| Open with DEXTER | |
Appendix C: Spectral energy distributions
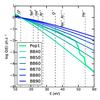 |
Fig. C.1
Log of Q(E), the number of photons emitted above the energy threshold E as a function of E, for different spectral energy distributions (SEDs). The ionization thresholds of important ions are indicated by the vertical dashed lines. The different curves correspond to blackbodies at different temperatures, as indicated in the inset. The PopStar model at an age of 1 Myr of Fig. C.4 is shown for comparison. |
| Open with DEXTER | |
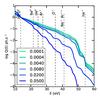 |
Fig. C.2
Same as Fig. C.1 for SEDs obtained by PopStar at an age of 1 Myr for a Chabrier (2003) stellar initial mass and different metallicities Z as indicated by the color code in the inset. |
| Open with DEXTER | |
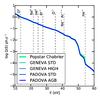 |
Fig. C.3
Same as Fig. C.1 for several SEDs obtained with starburst99 with a Kroupa (2001) stellar initial mass function for a metallicity Z = 0.004 at an age of 1 Myr. The color coding indicates the different cases proposed by starburst99: Geneva tracks with standard mass loss, Geneva tracks with high mass loss, original Padova tracks, and Padova tracks with AGB stars. The PopStar model at an age of 1 Myr is shown for reference. We see that, at this age, all the SEDs are exactly sumperimposed. |
| Open with DEXTER | |
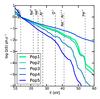 |
Fig. C.4
Same as Fig. C.1, but with SEDs corresponding to PopStar models at a metallicity Z = 0.004 for different ages (1, 2, 3, 4, and 5 Myr). |
| Open with DEXTER | |
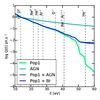 |
Fig. C.5
Same as Fig. C.4 for SEDs corresponding to AGN spectral energy distribution, combined PopStar at an age of 1 Myr and AGN (Sect. 5.5), and combined PopStar at an age of 1 Myr and bremsstrahlung (Sect. 5.3). The pure PopStar model at an age of 1 Myr of Fig. C.4 is shown for comparison. |
| Open with DEXTER | |
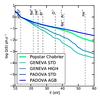 |
Fig. C.6
Same as Fig. C.3, but for an age of 4 Myr. Here, all the SEDs are harder than in the 1 Myr case, because of Wolf-Rayet stars. We also note a substantial difference between the various SEDs. |
| Open with DEXTER | |
© ESO, 2015
Current usage metrics show cumulative count of Article Views (full-text article views including HTML views, PDF and ePub downloads, according to the available data) and Abstracts Views on Vision4Press platform.
Data correspond to usage on the plateform after 2015. The current usage metrics is available 48-96 hours after online publication and is updated daily on week days.
Initial download of the metrics may take a while.