Fig. B.3
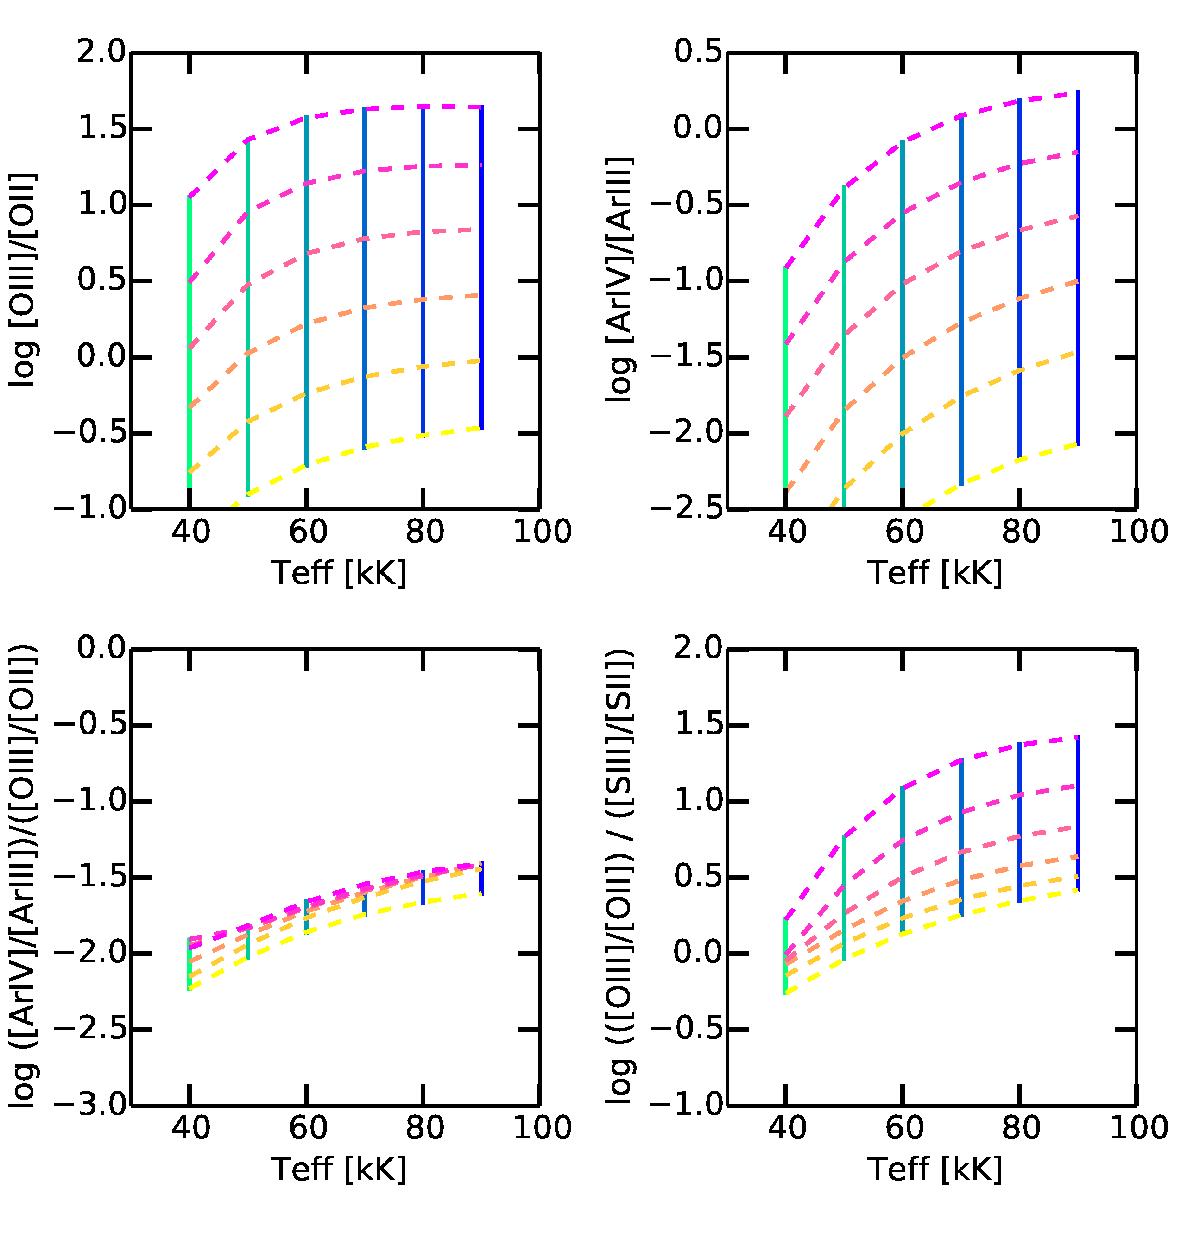
Variations of several line ratios with blackbody temperature for different values of the ionization parameter (ionization-bounded models with 12 + log O/H = 8). Continuous lines join models of same effective temperature, while dashed lines join models with same ionization parameter. The color coding is the same as in Fig. 11.
Current usage metrics show cumulative count of Article Views (full-text article views including HTML views, PDF and ePub downloads, according to the available data) and Abstracts Views on Vision4Press platform.
Data correspond to usage on the plateform after 2015. The current usage metrics is available 48-96 hours after online publication and is updated daily on week days.
Initial download of the metrics may take a while.