| Issue |
A&A
Volume 576, April 2015
|
|
|---|---|---|
| Article Number | A20 | |
| Number of page(s) | 18 | |
| Section | Galactic structure, stellar clusters and populations | |
| DOI | https://doi.org/10.1051/0004-6361/201425239 | |
| Published online | 16 March 2015 | |
Online material
Appendix A
Here we provide additional plots similar to the ones shown throughout the main body of the text, showing the principal results from the analysis of Sgr A* observations taken in the polarization mode (NACO), but using the entire data set without limitation to the only significant values.
|
Fig. A.1
Left: altitude (elevation) of Sgr A* as a function of polarization angle as derived from all data. Right: total flux density as a function of polarization angle; the bin width in polarization angle is 15°. The values for individual measurements are shown as black dots. The mean values per bin are shown as red dots with error bars indicating the standard deviation, if the number of data points per bin is larger than 2. |
|
| Open with DEXTER | |
|
Fig. A.2
Left: distribution of Ks-band polarization angles of Sgr A* for the entire data set. The red line shows the fit with a Gaussian distribution. Right: distribution of Ks-band polarization degrees of Sgr A* for the entire data set. |
|
| Open with DEXTER | |
|
Fig. A.3
Left: histogram of polarized flux density (total flux density times polarization degree) for the whole data set after correction for stellar contamination. Right: same plot in logarithmic scale. |
|
| Open with DEXTER | |
Comparison between the figures in the main text and those shown here in the Appendix allows the reader to get an impression of the effect of selecting the most significant values for the analysis presented.
|
Fig. A.4
Left: total flux density and degree of polarization relation for the entire data after correction for the offset. Right: total flux density and angle of polarization relation for the entire data after correction for the offset. |
|
| Open with DEXTER | |
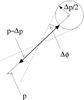 |
Fig. A.5
Approximate relation Δp ~ ptan(Δφ) between the mean uncertainty of the polarization angle Δφ and the polarization degree Δp. Here polarization degree p and polarization angle φ are projected on the sky. |
| Open with DEXTER | |
© ESO, 2015
Current usage metrics show cumulative count of Article Views (full-text article views including HTML views, PDF and ePub downloads, according to the available data) and Abstracts Views on Vision4Press platform.
Data correspond to usage on the plateform after 2015. The current usage metrics is available 48-96 hours after online publication and is updated daily on week days.
Initial download of the metrics may take a while.