Fig. A.1
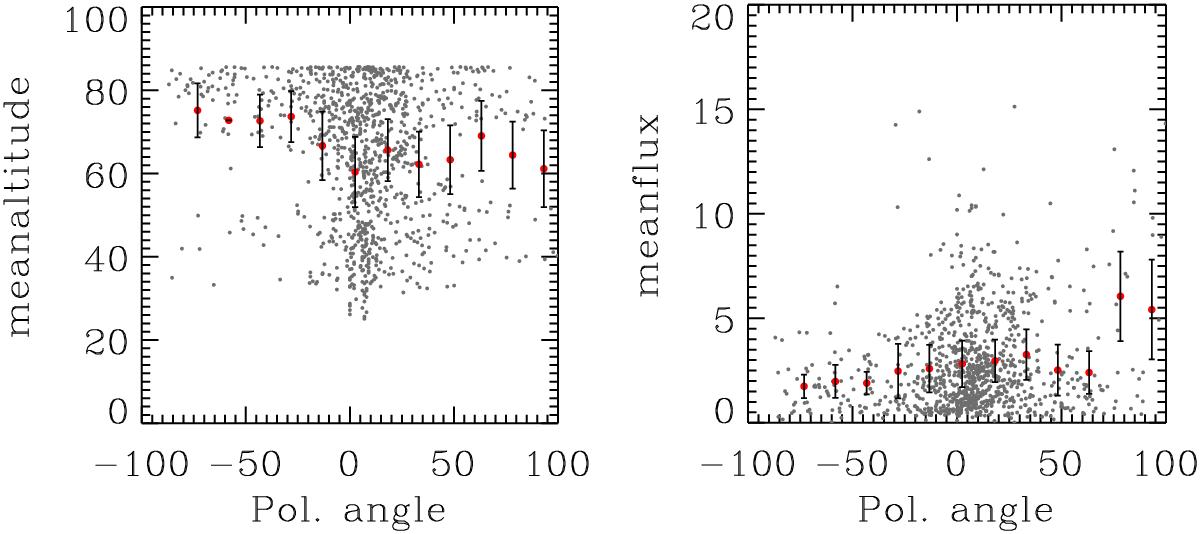
Left: altitude (elevation) of Sgr A* as a function of polarization angle as derived from all data. Right: total flux density as a function of polarization angle; the bin width in polarization angle is 15°. The values for individual measurements are shown as black dots. The mean values per bin are shown as red dots with error bars indicating the standard deviation, if the number of data points per bin is larger than 2.
Current usage metrics show cumulative count of Article Views (full-text article views including HTML views, PDF and ePub downloads, according to the available data) and Abstracts Views on Vision4Press platform.
Data correspond to usage on the plateform after 2015. The current usage metrics is available 48-96 hours after online publication and is updated daily on week days.
Initial download of the metrics may take a while.