| Issue |
A&A
Volume 575, March 2015
|
|
|---|---|---|
| Article Number | A82 | |
| Number of page(s) | 31 | |
| Section | Interstellar and circumstellar matter | |
| DOI | https://doi.org/10.1051/0004-6361/201424568 | |
| Published online | 27 February 2015 | |
Online material
Appendix A: MADEX: a local, non-LTE LVG code
The physical conditions in ISM clouds are such that molecular excitation is usually far from LTE. MADEX solves the non-LTE level excitation and line radiative transfer in a 1D isothermal homogeneous medium assuming a large velocity gradient (LVG) and spherical geometry. In this approximation the statistical-equilibrium equations are solved assuming local excitation conditions and a geometrically averaged escape probability formalism for the emitted photons (see details in Sobolev 1960; Castor 1970). This description allows one to take into account radiative trapping and collisional excitation and deexcitation more easily and computationally faster than more sophisticated non-local codes in which the radiative coupling between different cloud positions is explicitly treated (Montecarlo simulations, ALI methods, etc.). As a small benchmark, and in order to place the conclusions of our work on a firm ground, here we compare MADEX results with those obtained with RADEX6, a publicly available escape probability code (see van der Tak et al. 2007 for the basic formulae).
We ran several models for CO (a low-dipole moment molecule with μ = 0.12 D) and for HCO+ (μ = 3.90 D). These are typical examples of molecules with low and high critical densities, respectively (e.g. ncr(CO 2 → 1) of a few 104 cm-3 and ncr(HCO+2 → 1) of a few 106 cm-3). We note that for optically thin emission lines and for densities n(H2) ≫ ncr, collisions dominate over radiative excitations and level populations get closer to LTE (Tex → Tk) as the density increases. For optically thick lines, line trapping effectively reduces ncr and lines can be thermalized at lower densities. In the low density limit (n(H2) ≪ ncr), level populations are subthermally excited and, as the density decreases, tend to thermalize to the background radiation temperature (Tk>Tex → 2.7 K in the millimetre domain).
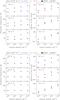 |
Fig. A.1
CO isothermal models carried out with MADEX (filled squares) and RADEX (empty squares) non-LTE radiative transfer codes. Two gas densities are considered: n(H2) = 3 × 103 cm-3 (upper panels) and n(H2) = 3 × 105 cm-3 (lower panels). Excitation temperatures and line centre opacities (left and right panels, respectively) are shown for several rotational transitions in the millimetre domain as a function of CO column density. Two gas temperatures are considered, 10 K (blue points) and 150 K (red points). |
| Open with DEXTER | |
Figure A.1 (upper panels) shows low density model results (n(H2) = 3 × 103 cm-3) for N(CO) from 1015 to 1018 cm-2 at two different gas temperatures (Tk = 10 and 150 K, blue and red points, respectively). The left and right figures show the computed excitation temperatures and line centre opacities, respectively, for the CO 2 → 1, 3 → 2, and 4 → 3 transitions. Figure A.1 (lower panels) shows higher density models (n(H2) = 3 × 105 cm-3) close to thermalization (Tex ≃ Tk). We note that the selected range of column densities represents a transition from optically thin to optically thick emission. A line width of 1 km s-1 is adopted in all models.
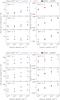 |
Fig. A.2
Same as Fig. A.1 but for HCO+. |
| Open with DEXTER | |
Figure A.2 shows the same kind of models for HCO+ (column densities from 1012 to 1015 cm-2). Owing to the much higher critical densities of HCO+ rotational transitions, their excitation is sub-thermal (Tex<Tk) in most of the explored parameter space. In addition, their associated emission lines become optically thick for column densities smaller than those of CO.
The filled and empty square marks in Figs. A.1 and A.2 represent computations performed with MADEX and RADEX codes, respectively. We checked that for the considered models, the predicted excitation temperatures and line opacities agree within ~20% and ~40%, respectively. This translates into maximum brightness temperature differences of ~50% in the most extreme cases.
Appendix B: Identified hydrocarbon lines
Line parameters of C2H.
Line parameters of 13CCH and C13CH.
Line parameters of l-C3H+.
Line parameters of l-C3H.
Line parameters of c-C3H.
Line parameters of c-C3H2.
Line parameters of l-H2C3.
Line parameters of C4H.
© ESO, 2015
Current usage metrics show cumulative count of Article Views (full-text article views including HTML views, PDF and ePub downloads, according to the available data) and Abstracts Views on Vision4Press platform.
Data correspond to usage on the plateform after 2015. The current usage metrics is available 48-96 hours after online publication and is updated daily on week days.
Initial download of the metrics may take a while.